Challenge
The signup patterns of the first 3,500 members
We provided the data, you provided the visuals! Submissions from the first Data Visualization Society’s challenge are featured in the gallery below.
Featured
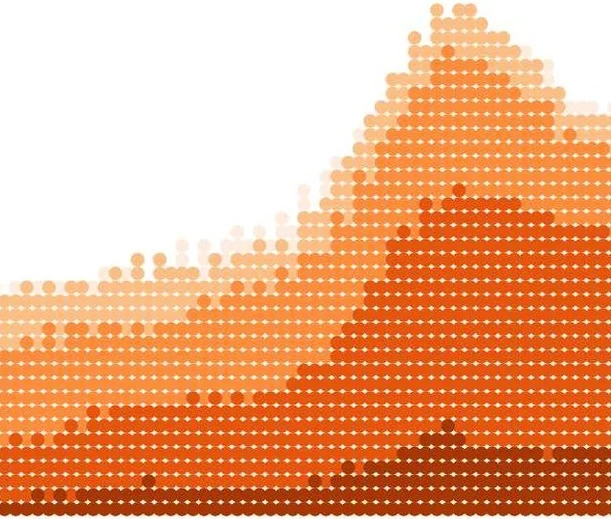
Daniel Zvinca
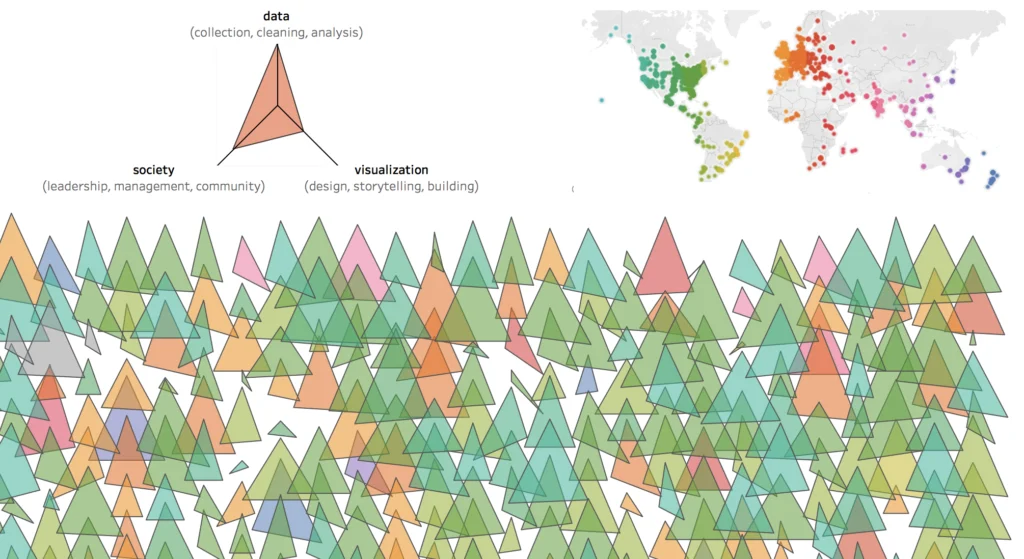
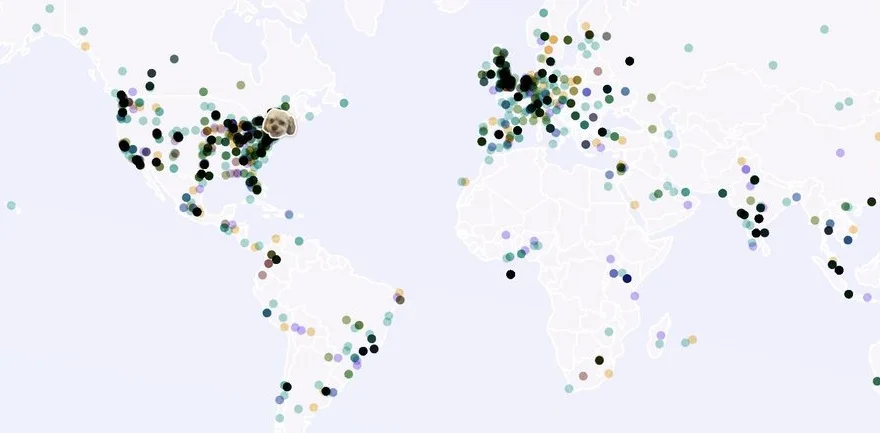
Marguerite Roth
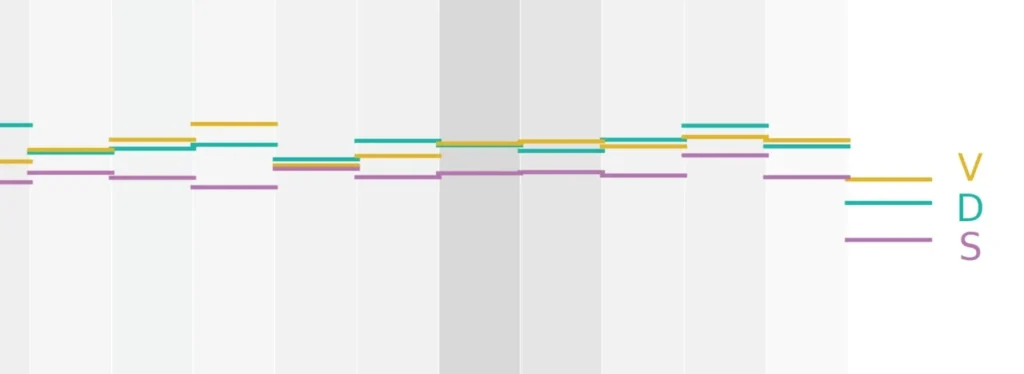
Time Series, Notebooks, python, Gimp
Time Series, Notebooks, python, Gimp
Francois Dion
Time Series, Notebooks, python, Gimp
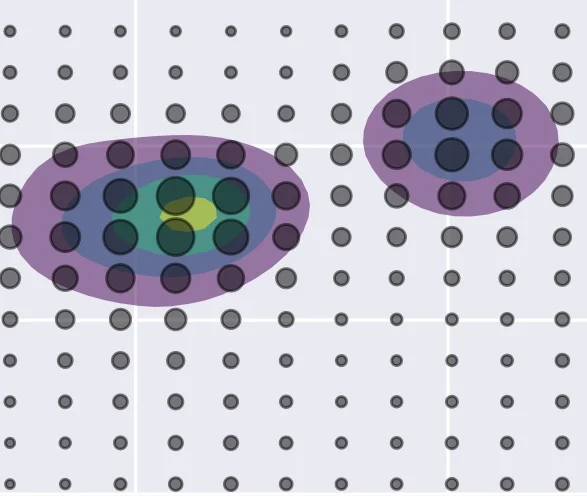
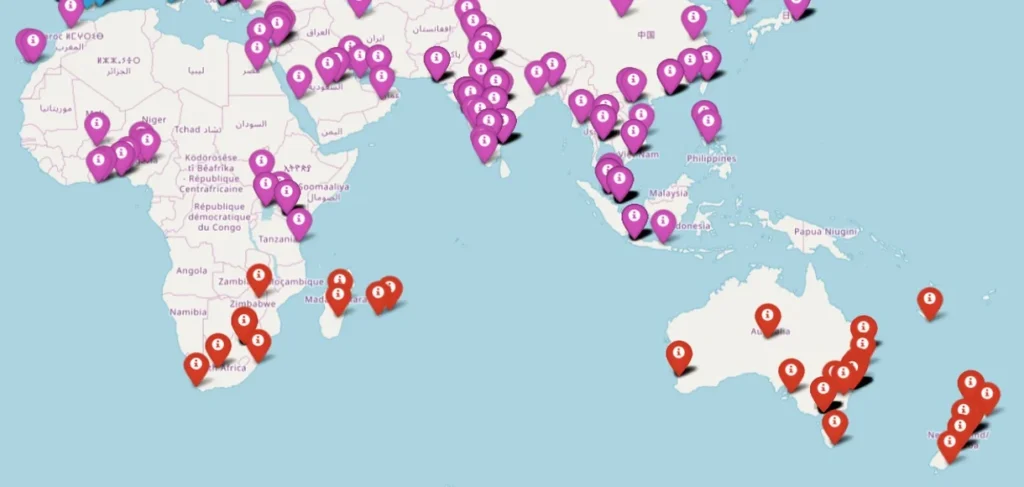
Map, Density, Notebooks, python
DVS, Where & Level of Visualization Skills
Map, Density, Notebooks, python
Francois Dion
Map, Density, Notebooks, python
Francois Dion
plot, QGIS, R, Illustrator, ggplot2
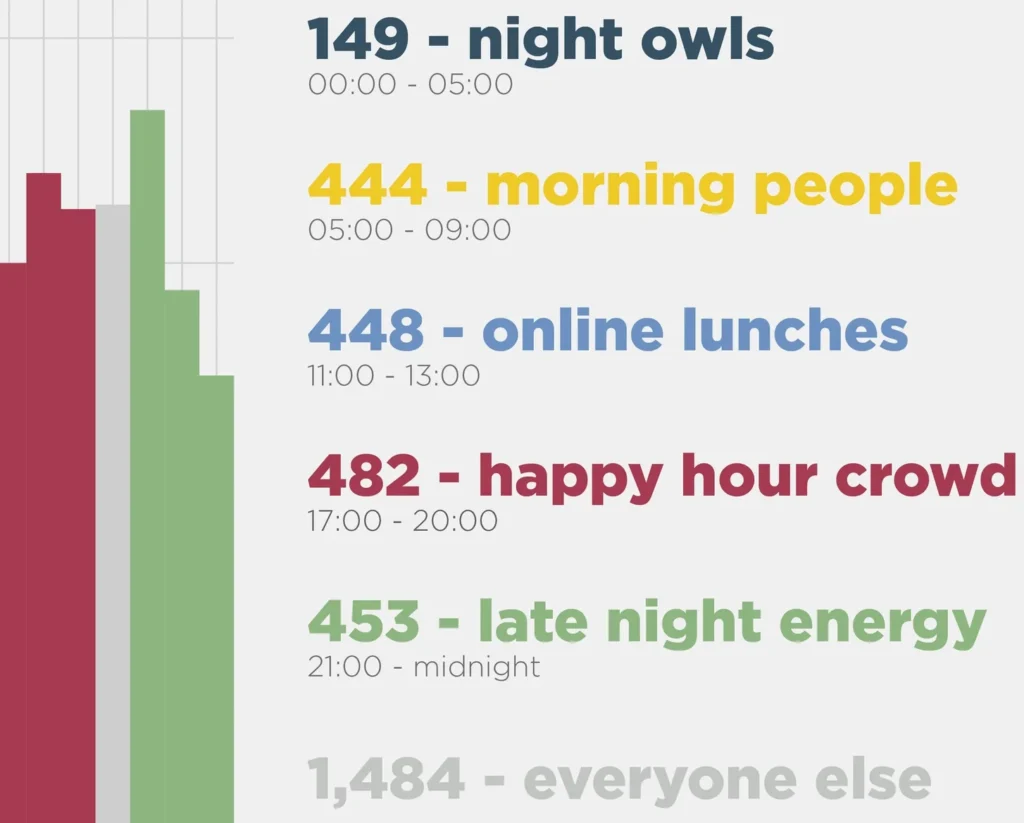
Visualizing the first 3,500 DVS members by sign-up time
plot, QGIS, R, Illustrator, ggplot2
Jared Whalen
plot, QGIS, R, Illustrator, ggplot2
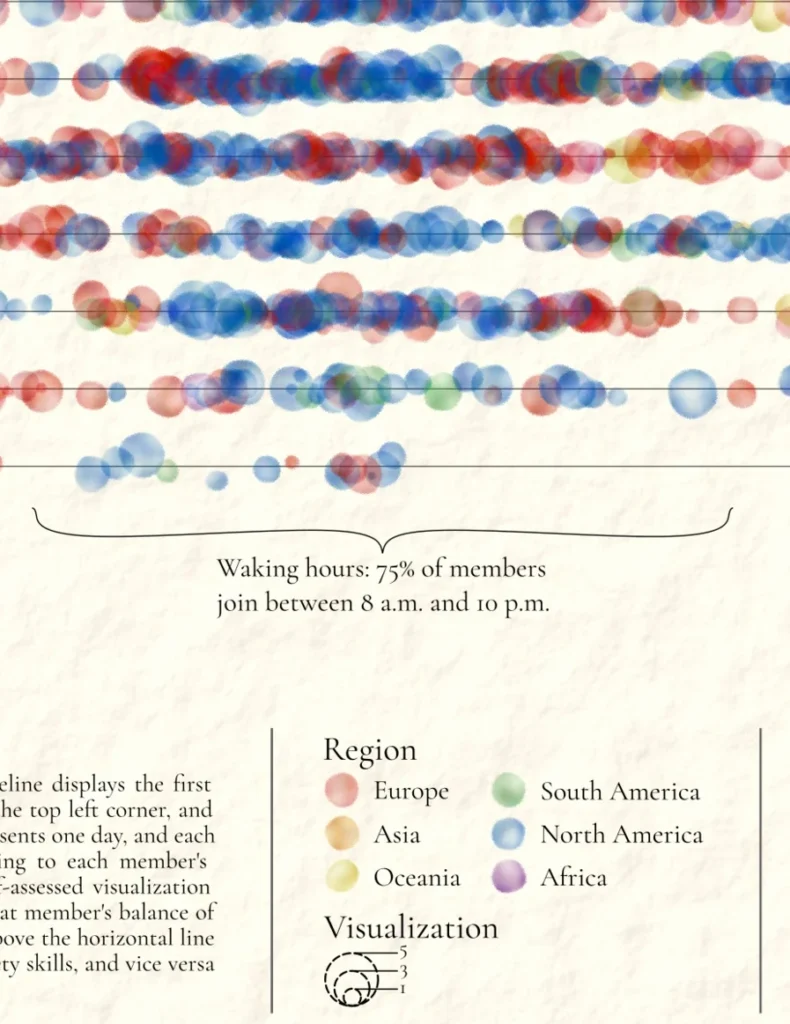
The Data Visualization Society Membership Timeline
Will Chase

@c-c-l
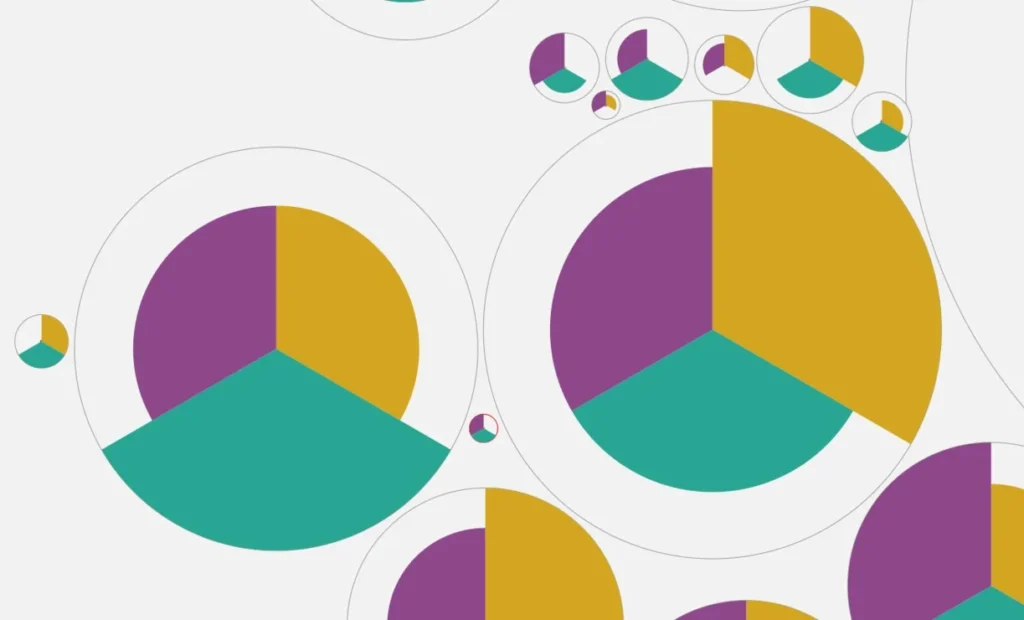
Adam Pearce
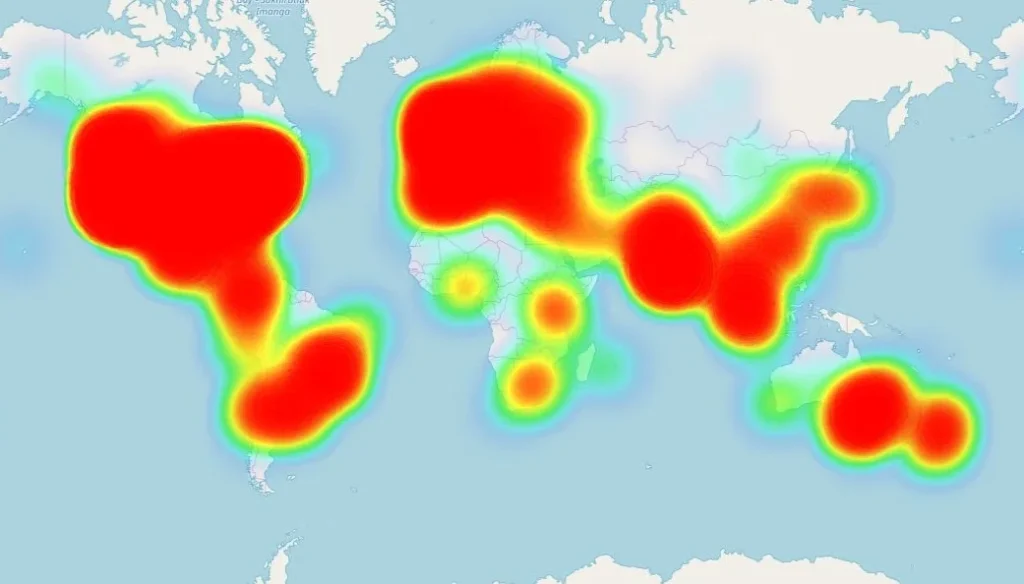
@emarchisa; @knowage_suite
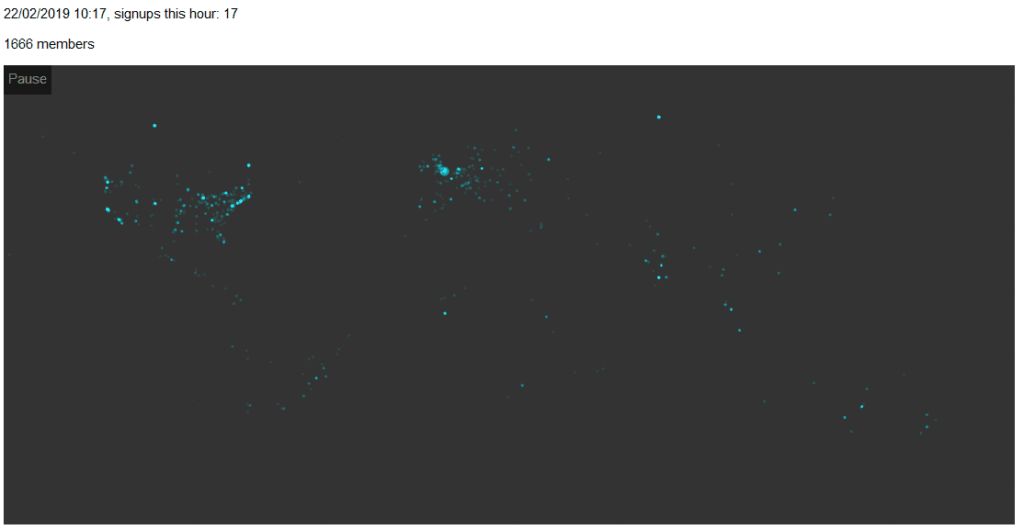
Map, Time Series, Animated, Audio, Music, Sound, Qlik, D3
Map, Time Series, Animated, Audio, Music, Sound, Qlik, D3
John Tibbutt (@tibbuttj)
Map, Time Series, Animated, Audio, Music, Sound, Qlik, D3
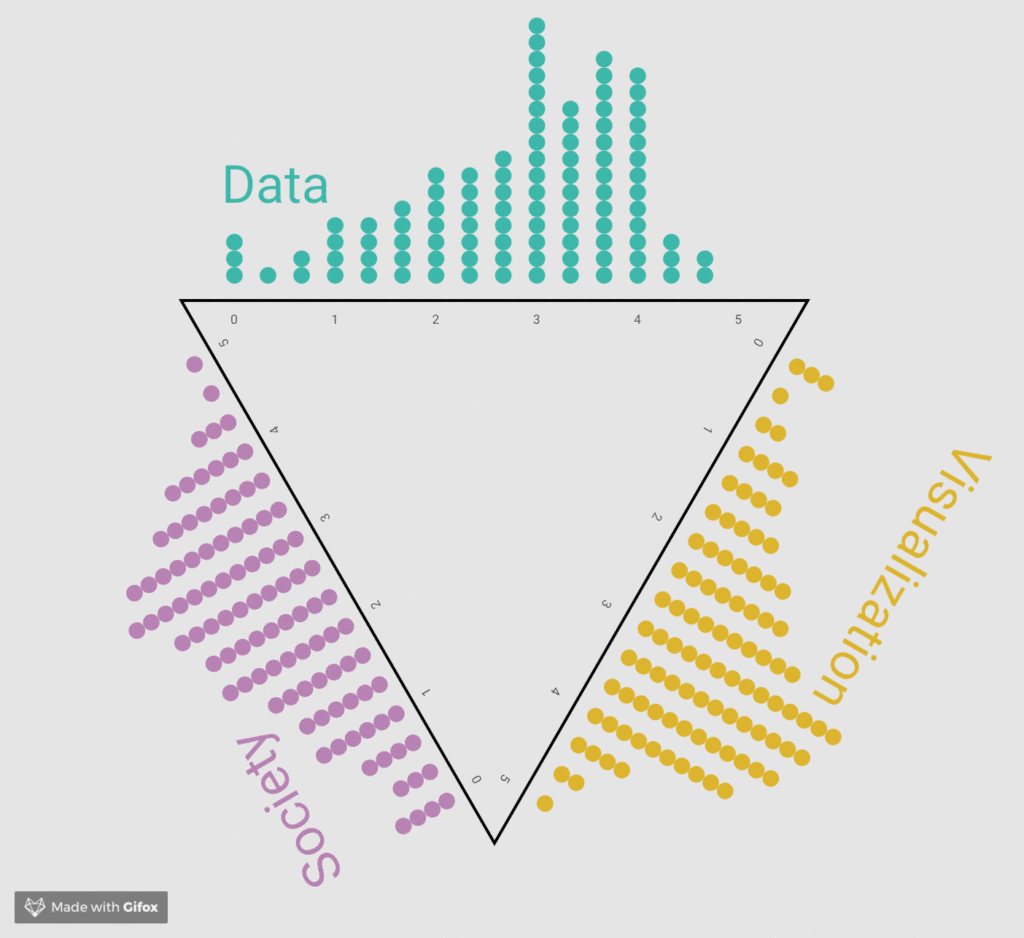
Needlessly Spinning Quantile Dotplots
Alex Wein
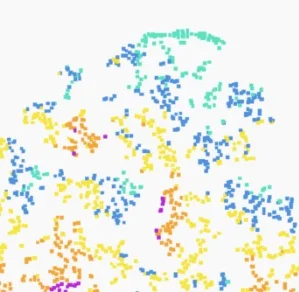
Dan McCarey, Maptian
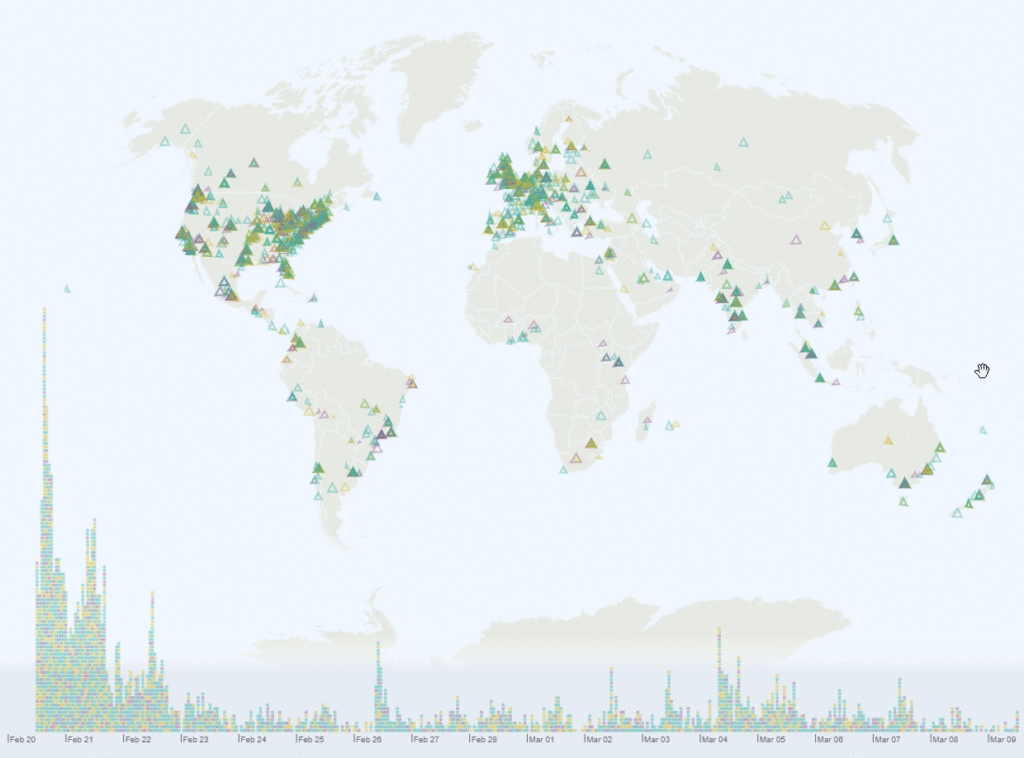
Map, Time Series, Interactive, D3
Interactive Exploration of the First DVS Signups
Map, Time Series, Interactive, D3
Philipp Koytek
Map, Time Series, Interactive, D3

Map, Time Series, Animated, Plot
Visualization of #datavizsociety
Map, Time Series, Animated, Plot
Vadim Shmygov
Map, Time Series, Animated, Plot
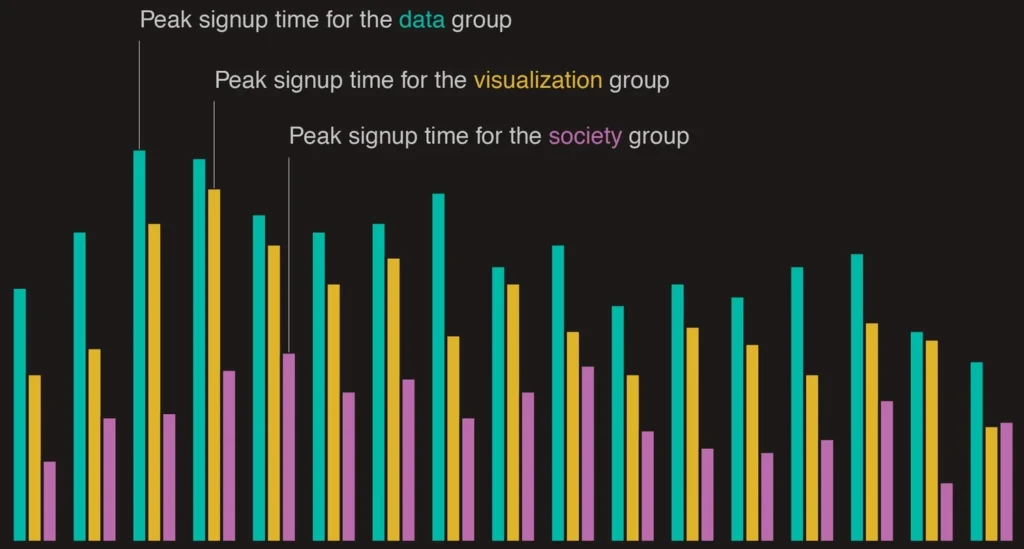
Alexander Koch

Craig Taylor – Ito World
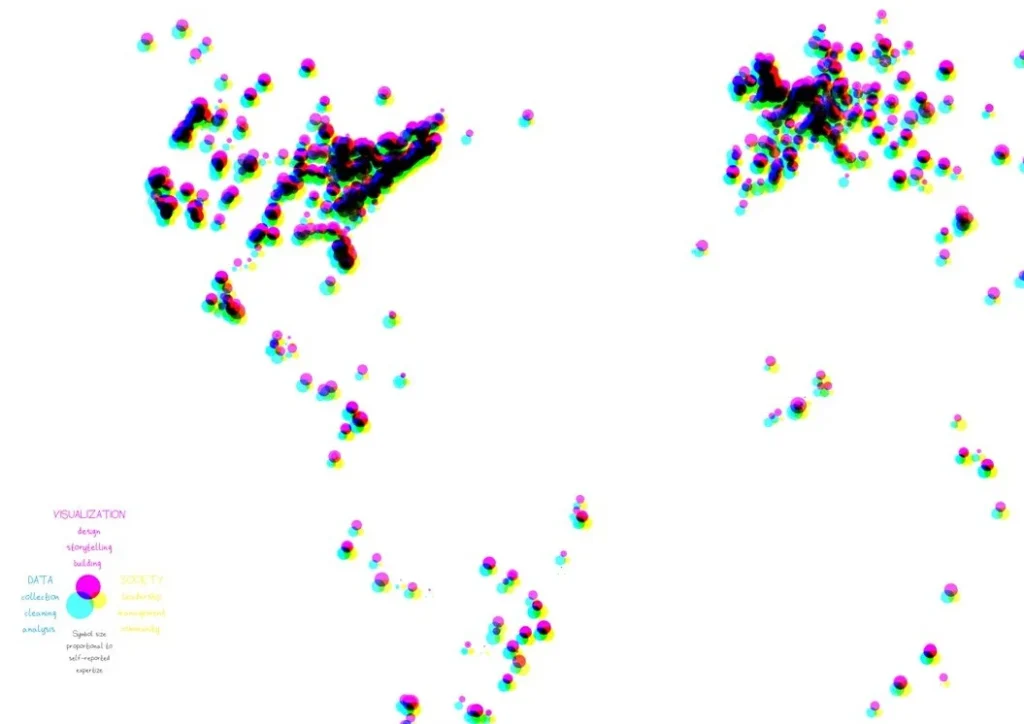
Kenneth Field

Animated, Plot, Heatmap, Notebooks, WebGL, Clustergrammer
Heatmap View using Clustergrammer2
Animated, Plot, Heatmap, Notebooks, WebGL, Clustergrammer
Nicolas Fernandez
Animated, Plot, Heatmap, Notebooks, WebGL, Clustergrammer
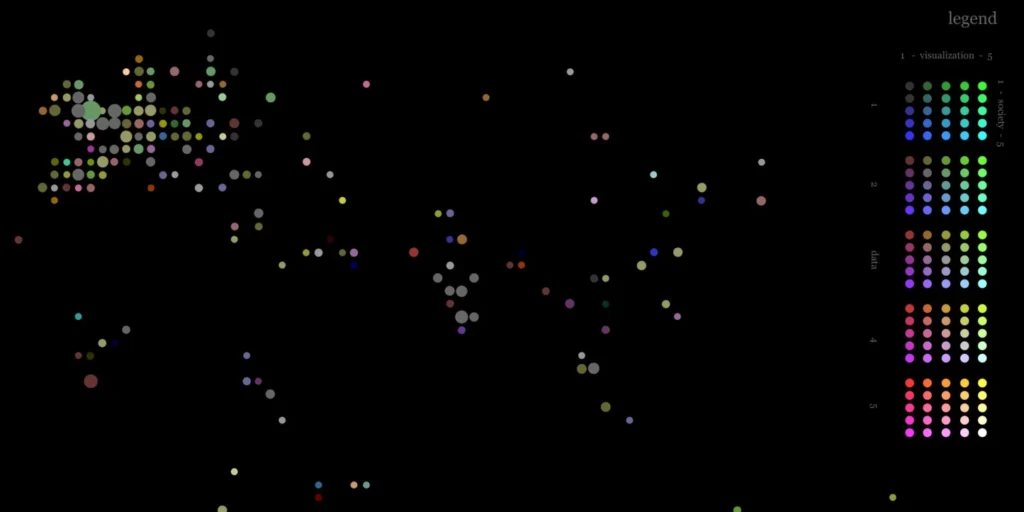
Data Visualization Society Membership
Mike Cisneros
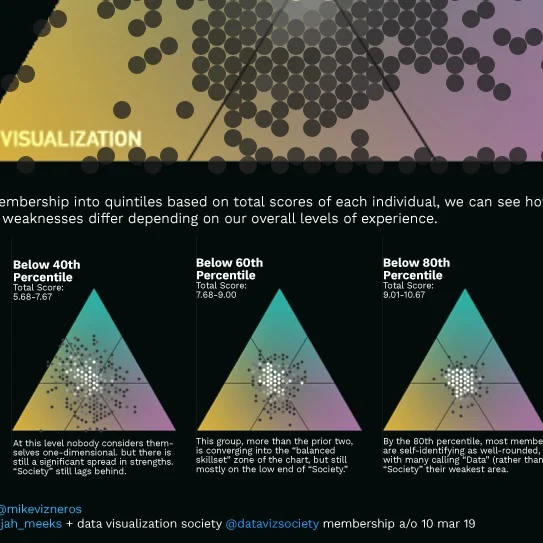
Mike Cisneros
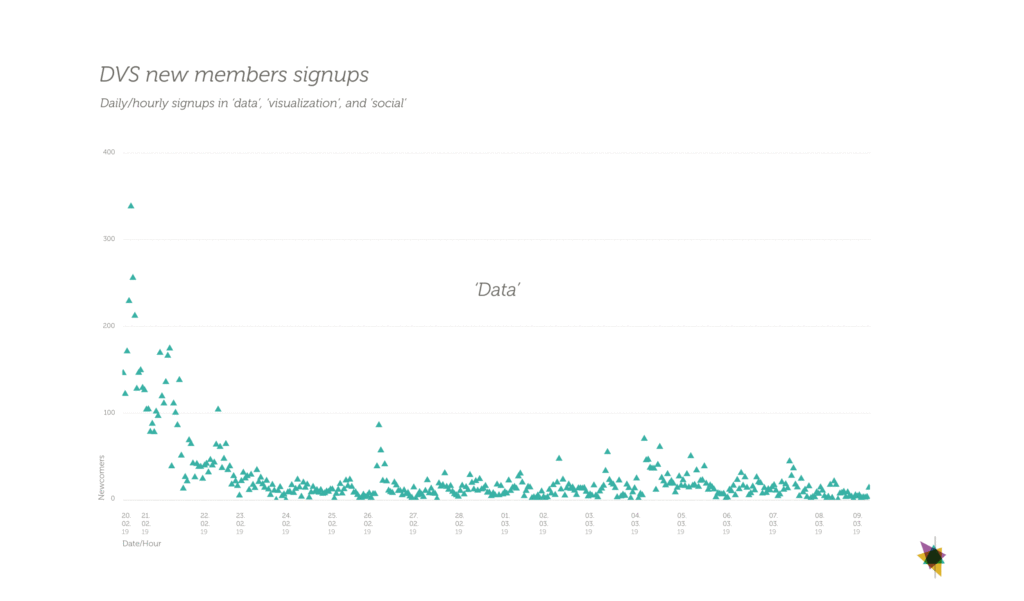
Map, Time Series, Rhythm, Rawgraphs, Datawrapper, Google Sheets
Map, Time Series, Rhythm, Rawgraphs, Datawrapper, Google Sheets
Inbal Rief, Desualizer
Map, Time Series, Rhythm, Rawgraphs, Datawrapper, Google Sheets
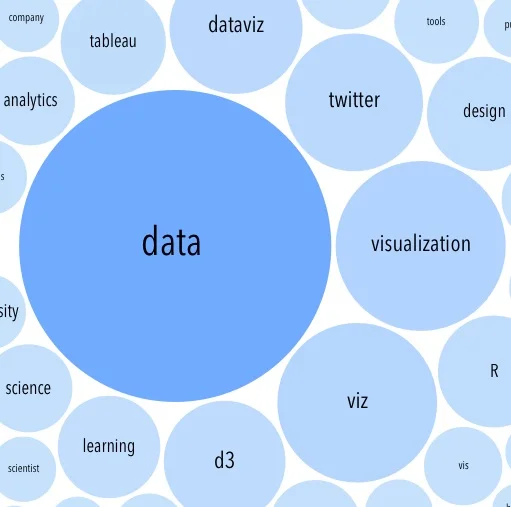
Plot, Pandas, Rawgraphs, Illustrator
Plot, Pandas, Rawgraphs, Illustrator
Duncan Greere
Plot, Pandas, Rawgraphs, Illustrator

Elijah Meeks
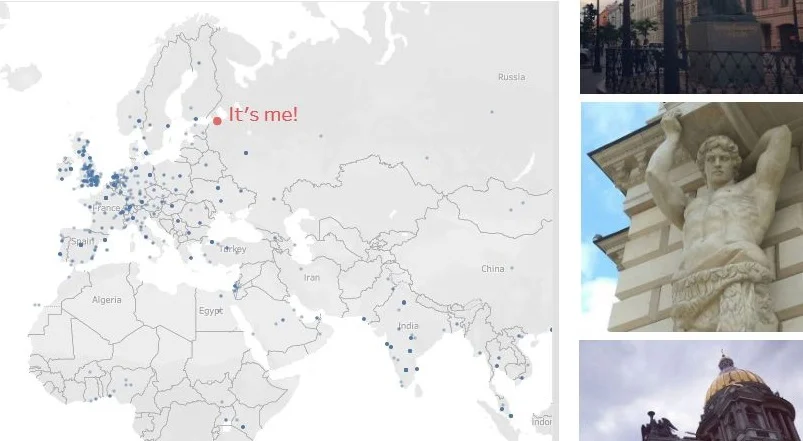
Natalia Kiseleva
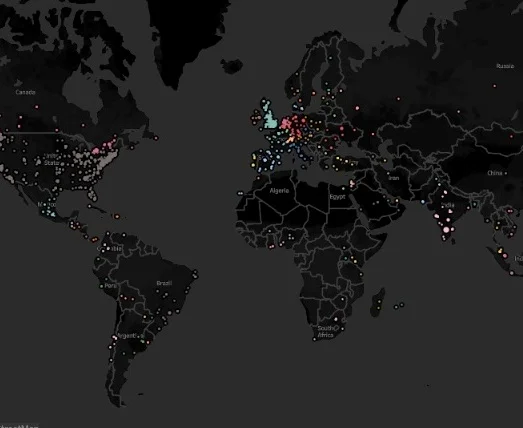
Map, Time Series, Animated, Plot
Data Visualization Society Launch
Map, Time Series, Animated, Plot
Wendy Small
Map, Time Series, Animated, Plot
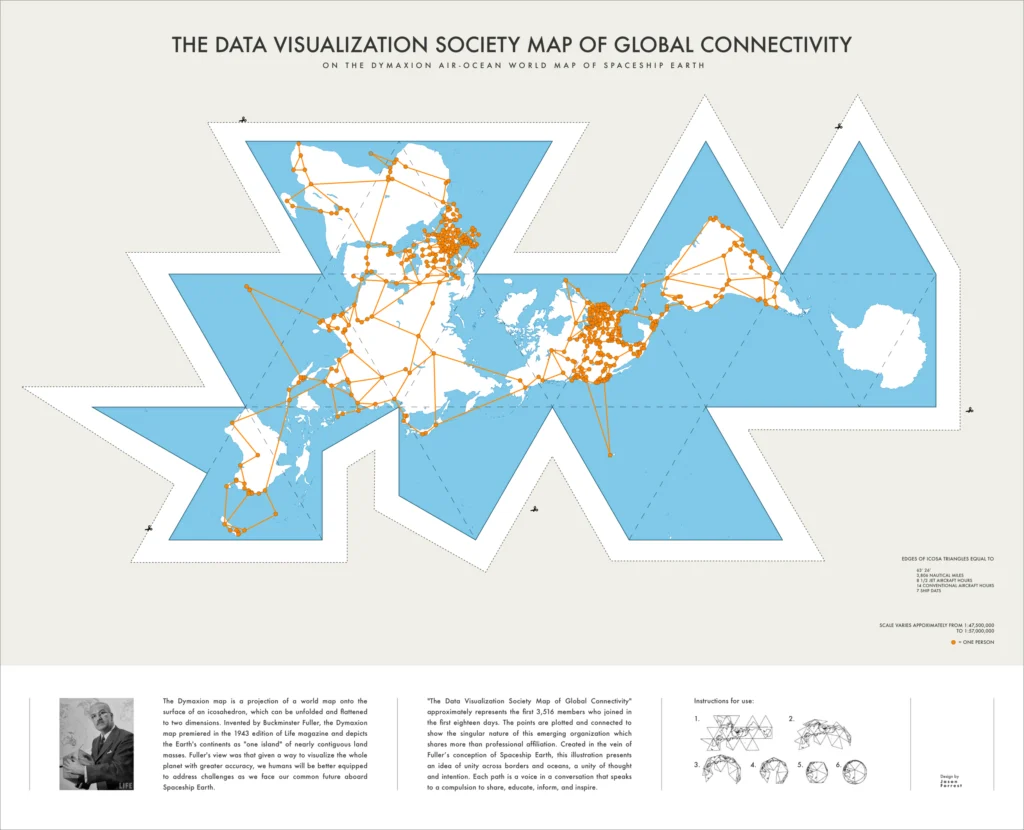
The Data Visualization Society Map of Global Connectivity
Jason Forrest
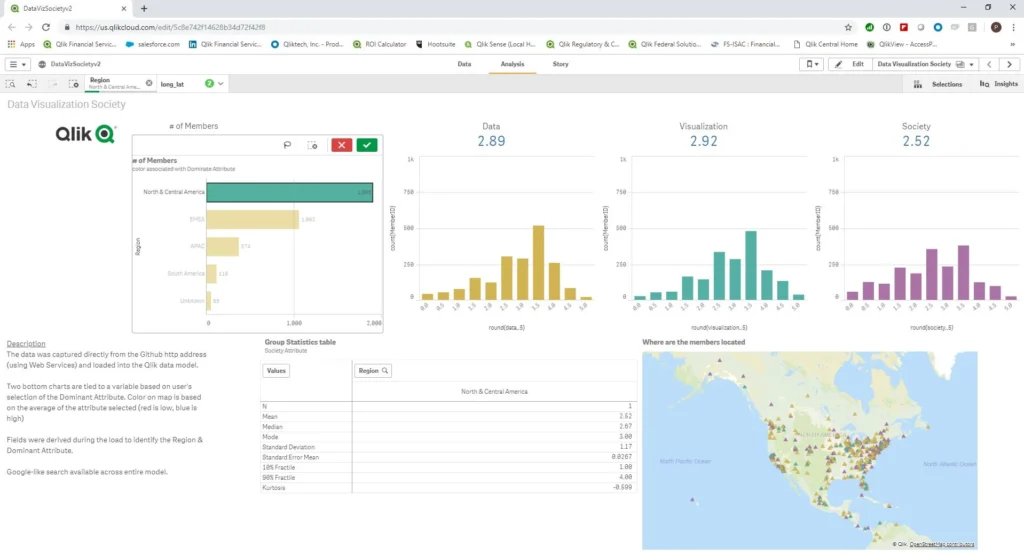
mobile, statistics, search, responsive design, Qlik, Map, Plot, Time Series
Interactive Dataviz with Mobile
mobile, statistics, search, responsive design, Qlik, Map, Plot, Time Series
Paul Van Siclen
mobile, statistics, search, responsive design, Qlik, Map, Plot, Time Series
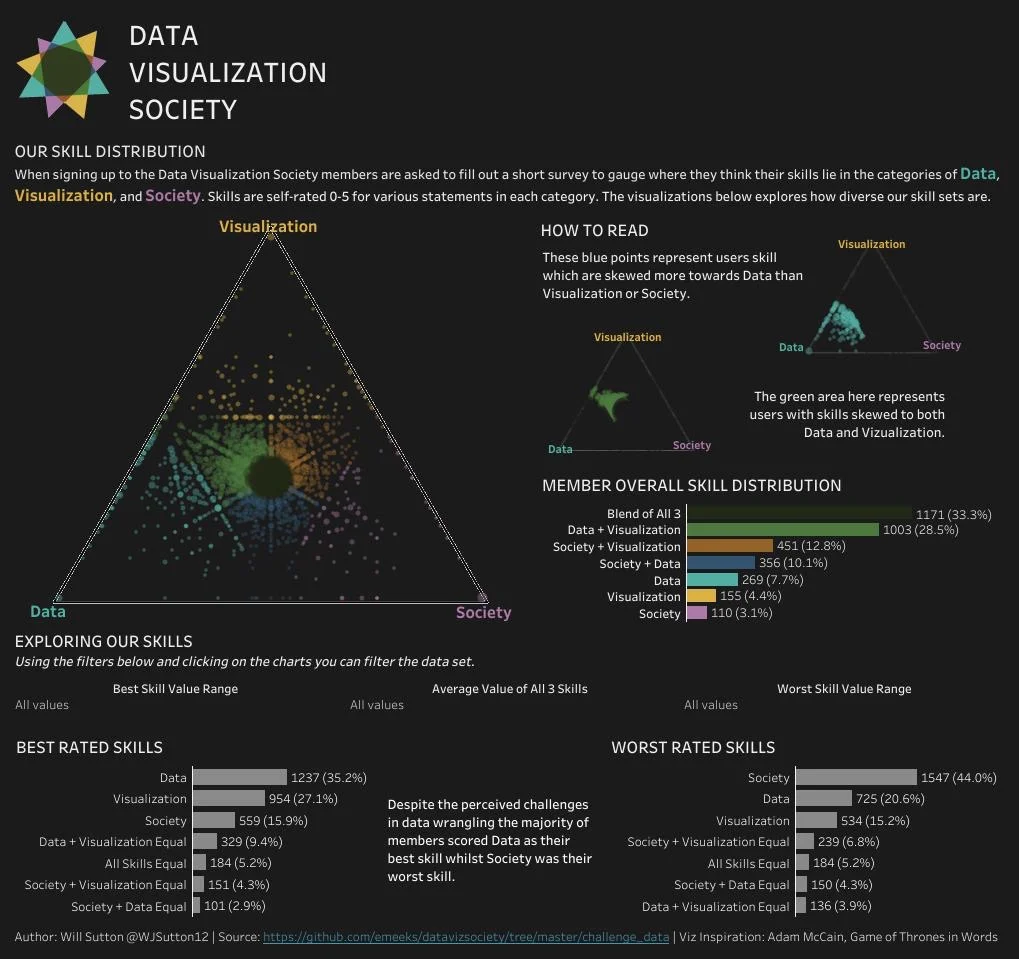
@wjsutton12 (instagram) @WJSutton12 (twitter)
