DVS 2019 survey Visualization
CREATED BY: Jatin Balodhi
DESCRIPTION:
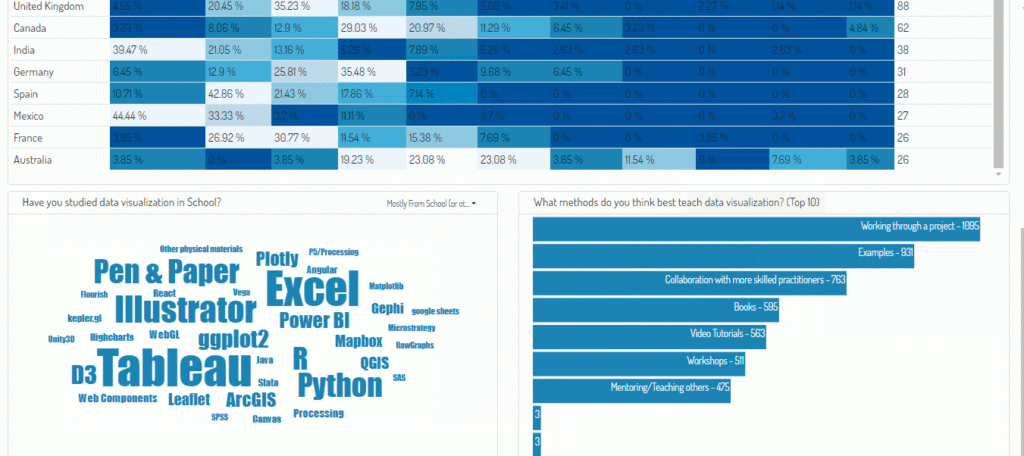
Data exploration on basis of Role, Tech used, Time spent, Country wise pay, Education background (college or self taught) and Methods of learning
PROCESS:
– Performed EDA using Excel and python.
– Extracted data using python and exported to JSON files.
– Created dashboard using HTML, CSS, Bootstrap, d3.js, jquery etc.
– Published the results on Github Pages (bcoz free to host).