SOTI Challenge 2021
Results are in! The State of the Industry Survey Challenge winners have arrived!!
Now we celebrate! There are first, second, and third place winners for both exploratory and explanatory visualizations and a winner for the beauty category (all highlighted below). This year we have decided not to award an accessibility prize; details of this can be found in a forthcoming article. However, we do highlight a few entries with accessibility honorable mentions for their efforts in making progress toward accessible visualizations.
Data
The 2021 Data Visualization SOTI Survey has responses to 60+ questions and was taken by over 2,100 people. It covers professional details like roles and tasks, tools and charts, experience, compensation, work contexts, challenges and changes (COVID-19 specific and otherwise), and more, plus demographic details. Naturally, we want to visualize it!
Judges
Entries are evaluated by a panel of judges including Alberto Cairo, Bill Shander, Neil Richards, Katy Börner, Alark Joshi, Vetria Byrd, PhD, Amy Cesal and Elijah Meeks. Entries will be evaluated on how engaging, impactful, clear, impressive, beautiful and accessible they are.
EXPLORATORY DATA VISUALIZATION
The most useful exploratory visualization. We want to see dashboards and other visualizations that let people generate and test their hypotheses about what motivates and affects the field.
EXPLANATORY DATA VISUALIZATION
The most engrossing explanatory visualization. We want to see the trends in the data and how they weave together to tell us what’s happening in the data viz community.
Beauty Prize
Entries will be evaluated to identify the data visualization with the most artistic merit.
Accessibility Prize
Entries will be evaluated to identify the data visualization that is the most accessible
Rules
- Each person can only enter two submissions and only one submission for each category.
- Entries are open to Data Visualization Society members. If you are not a member, it’s easy and free to join. Sign up here.
- Groups can enter but any cash-value prize will be awarded to the individual submitting the entry. Any group entry must be a list of names and cannot be an organization. Gallery space + online ribbons can be shared by all group members named.
- You must use the 2021 Annual State of the Industry Survey Data. You are also welcome to use annual survey data from previous years or other relevant datasets. If you use any additional datasets, they need to be cited.
- Any work presented must be your own.
- By entering you give DVS the non-exclusive right to publish your work and/or screenshots of it. (Examples of use: social media, website, emails and reports)
- All work must adhere to the DVS Code of Conduct.
- DVS board members, advisory committee, judges and their immediate family are not eligible to win prizes. However, they may enter and be included in the full gallery.
- The Data Visualization Society reserves the right to not award a prize for a category.
Submissions
Among Us
DVS Census, exploratory
Loris Mat
Exploring a few answers to create groups/subgroups and get an overview of data viz respondents in 2020 https://www.lorismat.com/work/dvs-survey
Learning Data Visualisation
DVS Census, explanatory
Evelina Judeikyte
As data visualisation is still an emerging field, many of us taught ourselves how to do it. This year's DVS census proves that. 93% of…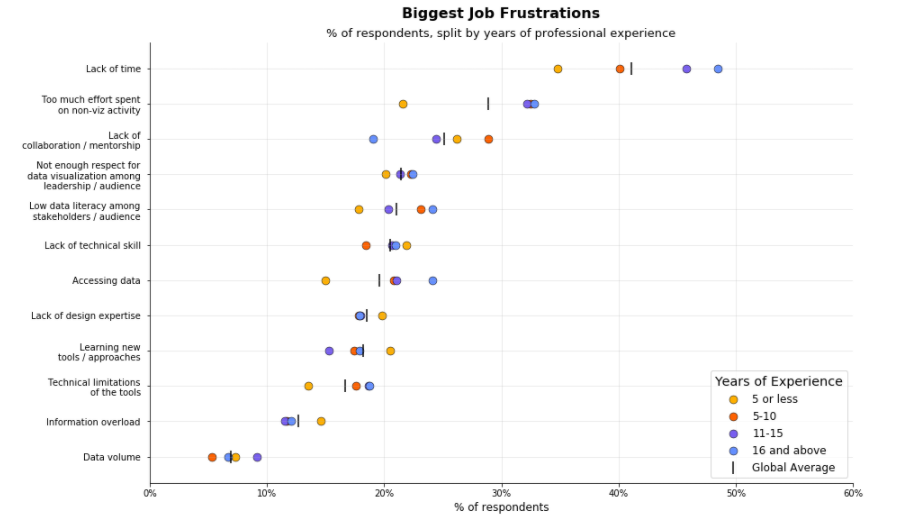
Preferences, Pain Points, Priorities
DVS Census, explanatory
Edric Ramos
Given the recent boom of interest in data science, I thought it would be great to see how different “generations” of practitioners differ in aspects…
The DVS Titles Edition: What your job title reveals (or not) about what you do…
DVS Census, exploratory
Anne-Marie Dufour and Inbal Rief
A job title is a term that describes the position held by us as an employee, or a freelancer. Mostly it reflects the level of…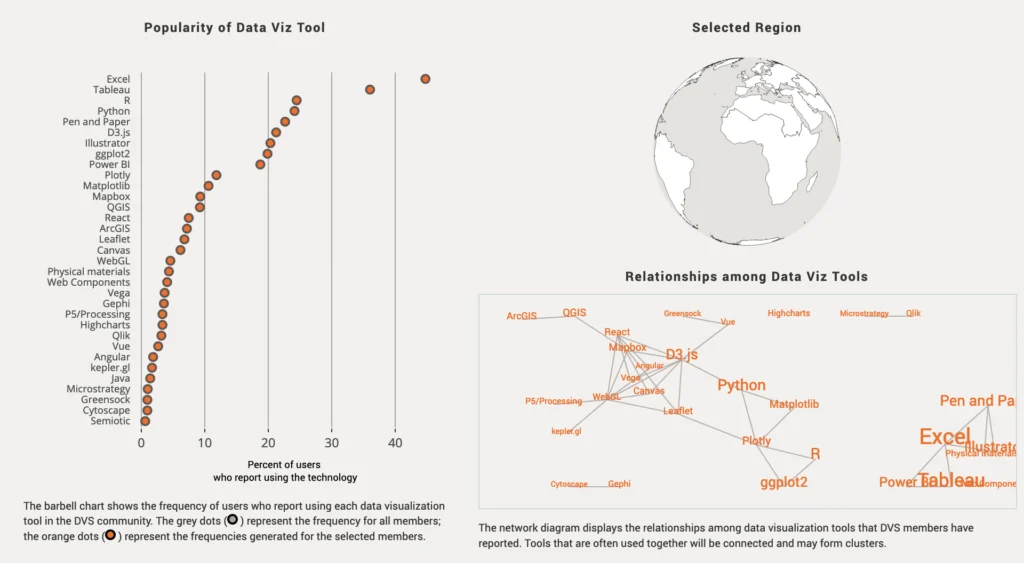
DVS Community Comparisons: Usage of and Relationships among Data Visualization Tools
DVS Census, exploratory
Patrick Coyle, Kiegan Rice, Peter Herman, Tereya Edwards, Luke Liu, and Devi Chelluri
This dashboard explores the relationships among data visualization tools that members of the DVS community have reported. The filters based on geographic region and demographics…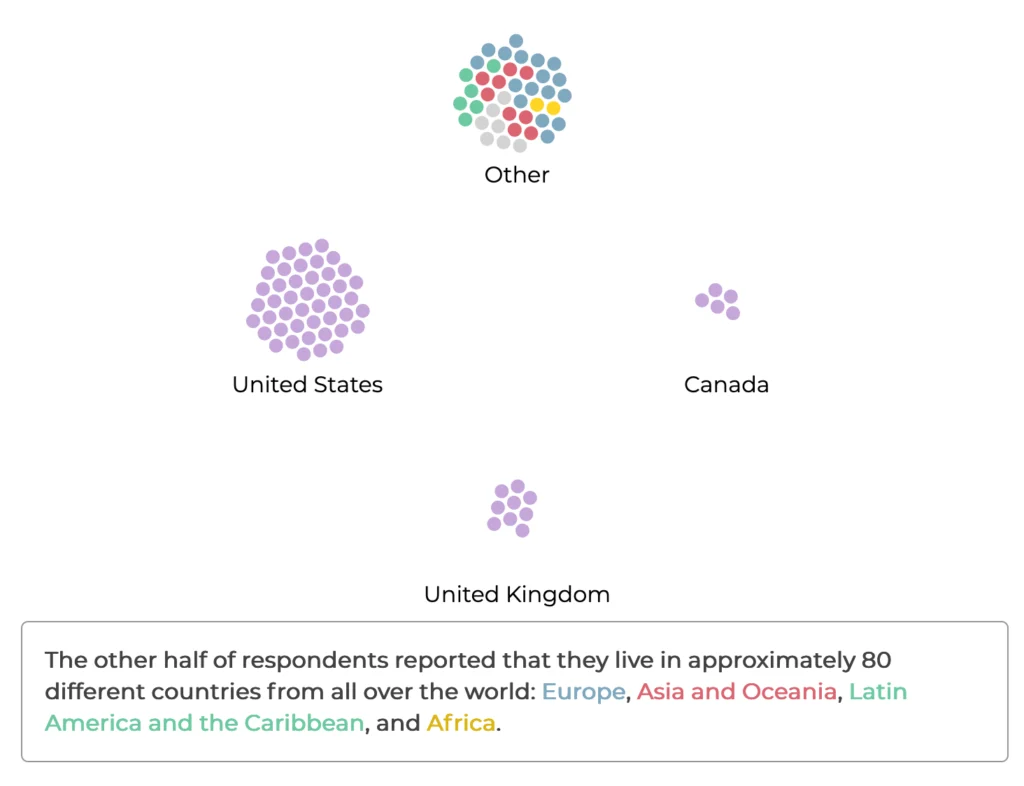
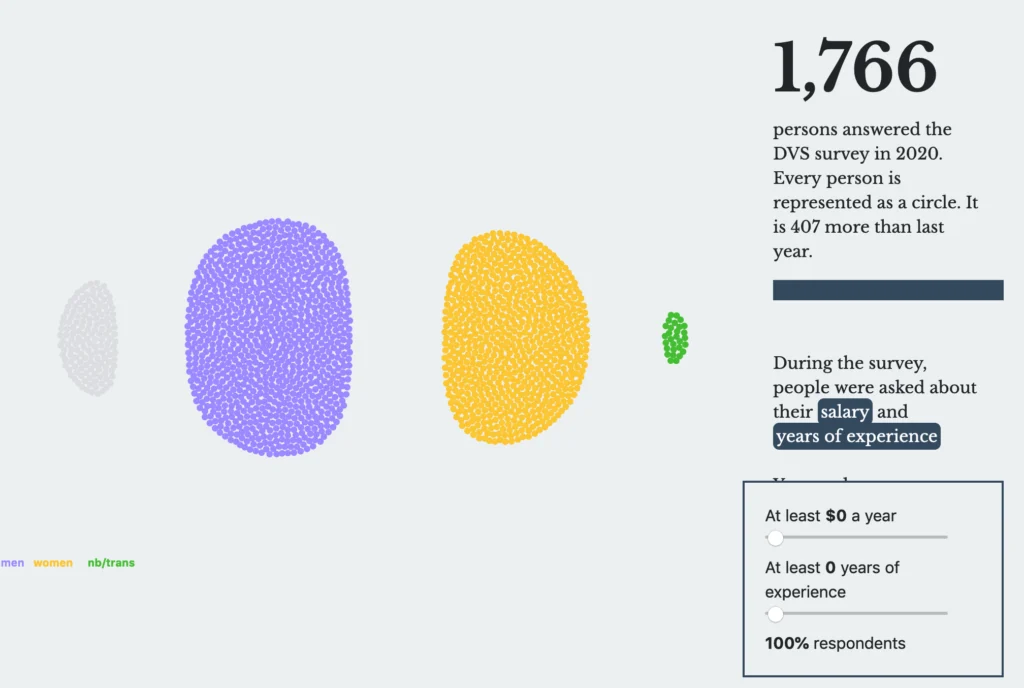
Members of the data visualization community as 100 people
DVS Census, explanatory
Maria Fedorova
Interactive visualization of the demographic characteristics of the Data Visualization Community members. For now best viewed on Desktop using Chrome. https://dataviz-survey-2020.netlify.app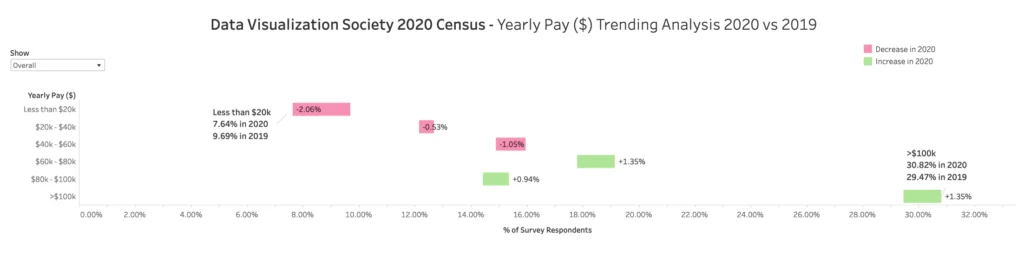
Are Data Visualization jobs becoming more valuable?
DVS Census, explanatory
Seán McConnell
This Gantt chart analyzes the change in yearly pay of Data Viz Society members. https://public.tableau.com/profile/sean.mcconnell#!/vizhome/2020DataVizSocietyCensus/YearlyPay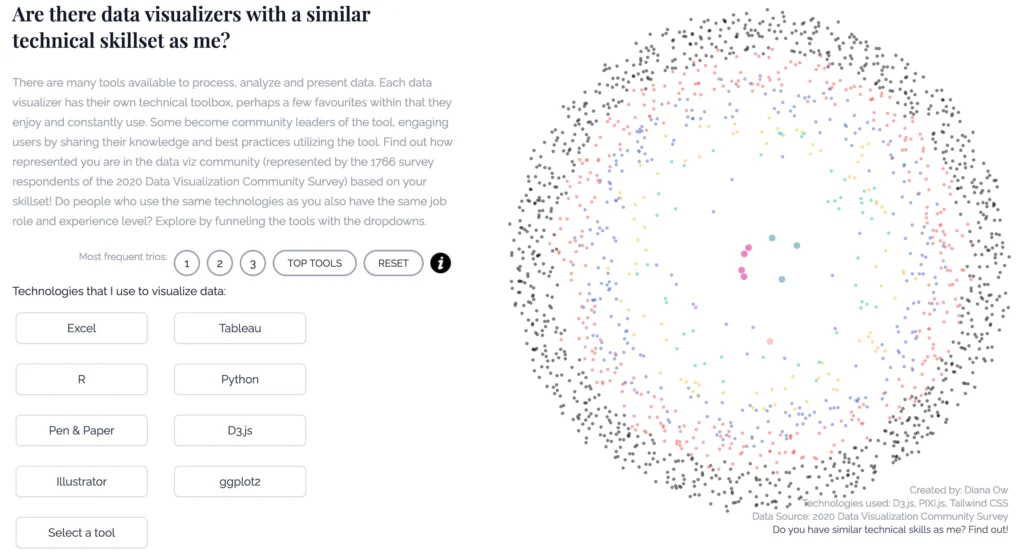
Are there data visualizers with a similar technical skillset as me?
DVS Census, exploratory
Diana
There are many tools available to process, analyze and present data. Each data visualization practitioner has his or her own technical toolbox. This interactive interface…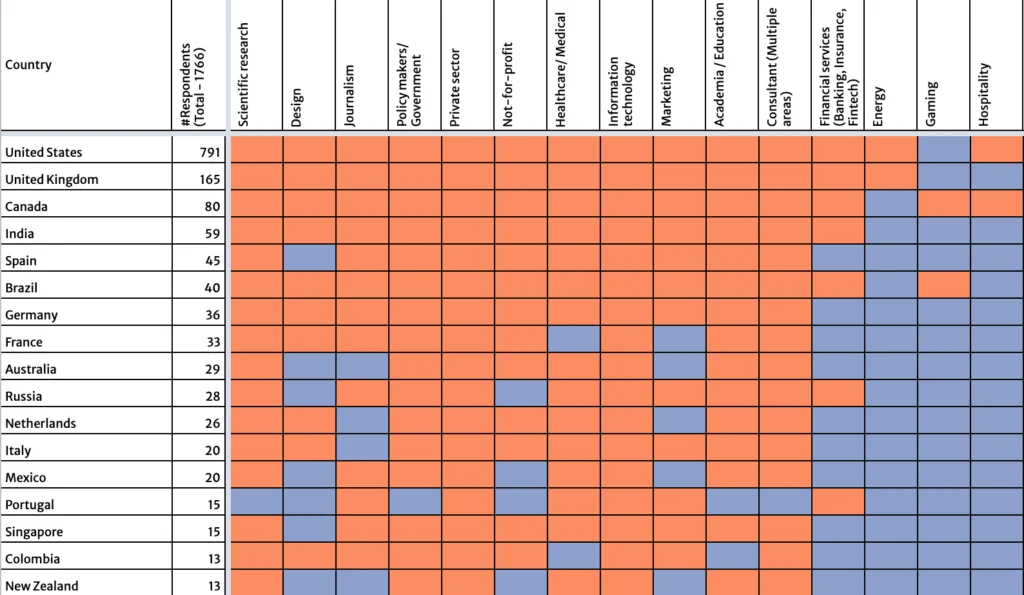
Country wise diversity of application domains of visualisation
DVS Census, explanatory
Amit Jena
Problem Description: I wanted to see how diverse is the application domains of data visualisation across the countries. DVS received a total of 1769 responses…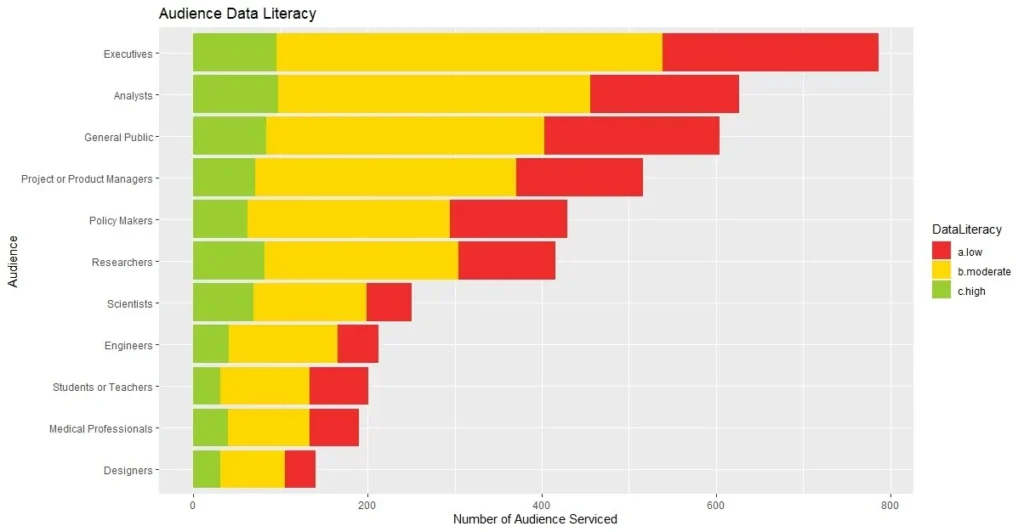
Data Literacy Level among Our Audience
DVS Census, explanatory
Eileen Huang
Low to moderate level of data literacy among our audience is the number one concern that the data viz community would like to improve. This…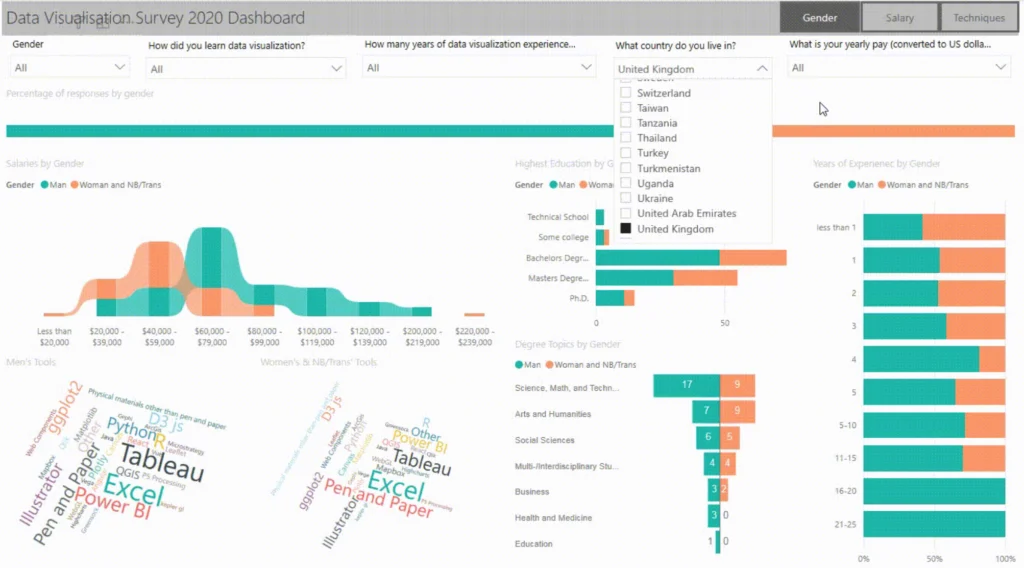
Data Visualisation Survey 2020 Analysis Dashboard
DVS Census, exploratory
Claire Rymarz
An interactive dashboard to explore relationships between gender, salary and techniques used in the data visualisation community. https://drive.google.com/file/d/1rbFO0397fd5mNI8gKnY3_fyrmE4G0pGV/view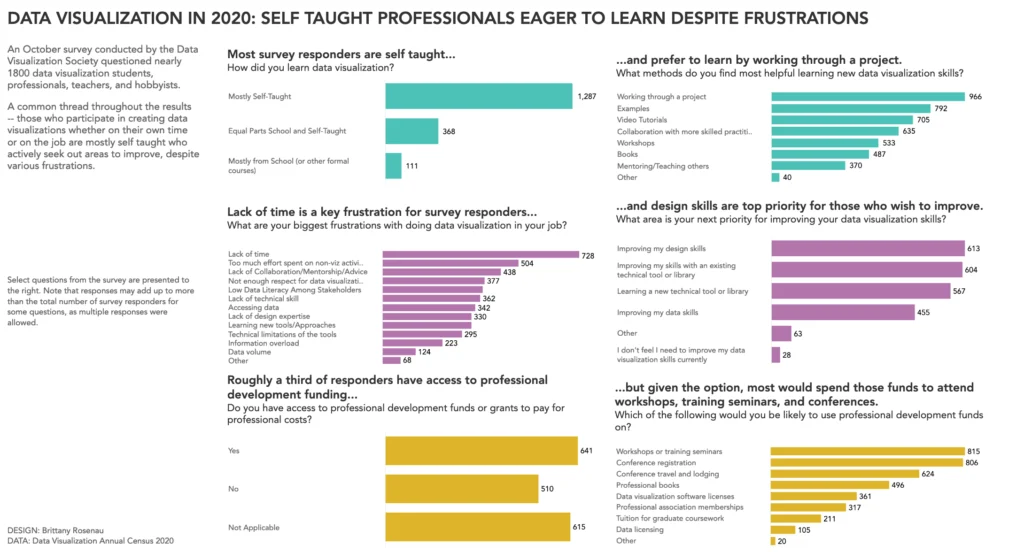
DATA VISUALIZATION IN 2020: SELF TAUGHT PROFESSIONALS EAGER TO LEARN DESPITE FRUSTRATIONS
DVS Census, explanatory
Brittany Rosenau
Exploring survey results related to professional development, frustrations, and top priorities for those who visualize data. Data prep in google sheets, viz in Tableau https://public.tableau.com/profile/brrosenau#!/vizhome/DVSSurveyResults/DVSSurveyResults
Decision fatigue and survey design, 2017 to 2020
DVS Census, explanatory
J. K. Dru
This work traces the evolution of the DVS census over the past four years. Inspired by Prachi Tank's elegant use of Google Sheets to visualize…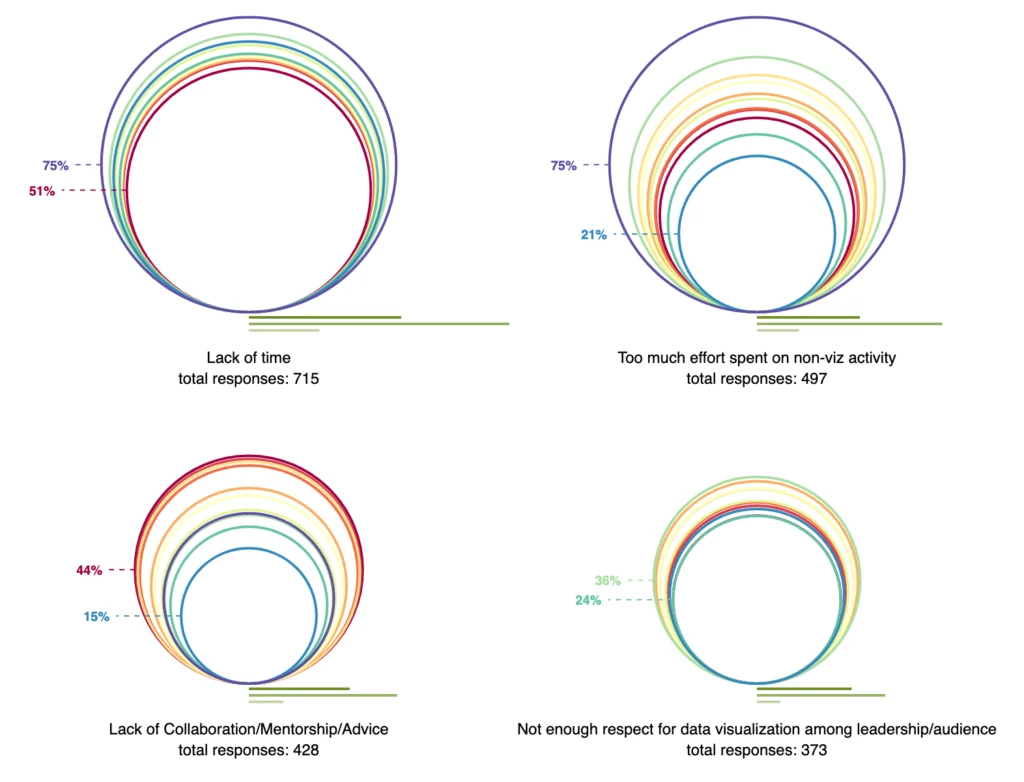
Does this job ever get easier?
DVS Census, explanatory
Sarah Hodges
A look at the different frustrations faced by data visualizers throughout their career https://observablehq.com/@slhstudio/does-this-job-ever-get-easier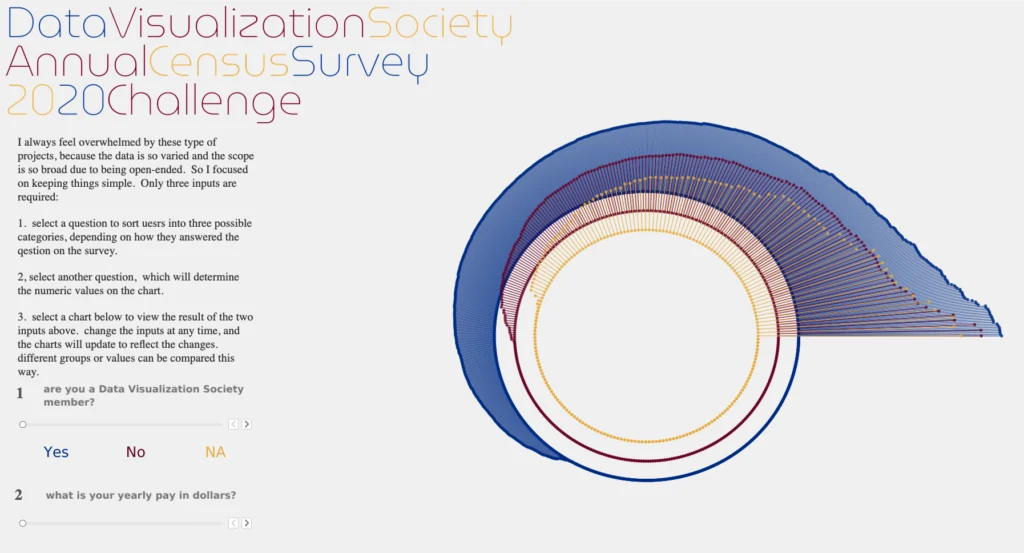
DVS2020
DVS Census, exploratory
Jonathan Yu
simplified exploration of the 2020 dvs survey results https://public.tableau.com/profile/jy00#!/vizhome/DVS2020/DVS2020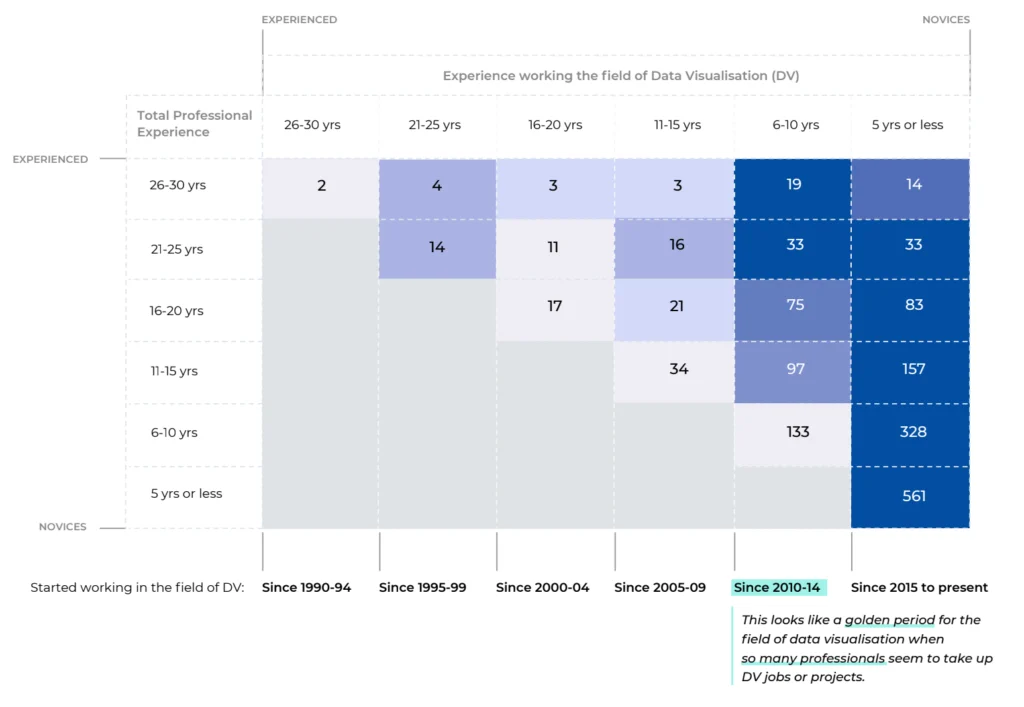
Experienced vs Novices
DVS Census, exploratory
Suchismita Naik
We all have varied experience levels when it comes to working in the field of data visualisation (DV). Some have started working right from the…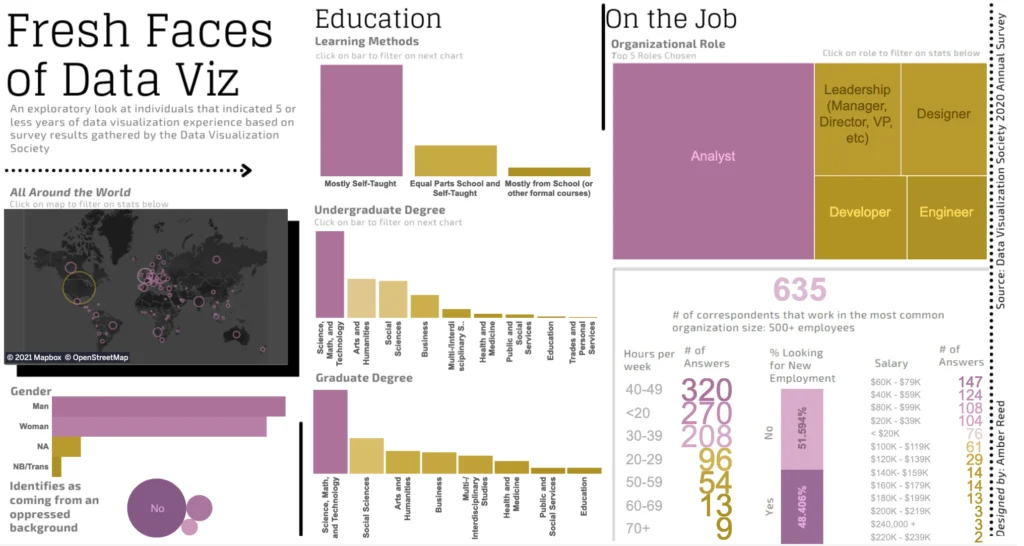
Fresh Faces of Data Viz
DVS Census, exploratory
Amber Reed
An exploratory look at the newest individuals to data viz, based on individuals that indicated 5 or less years of data visualization experience in the…
Frustrated Together
DVS Census, exploratory
Liuhuaying Yang
A little visualization aims to explore people’s frustrations in their work and the skills they would like to improve. If we take a look at…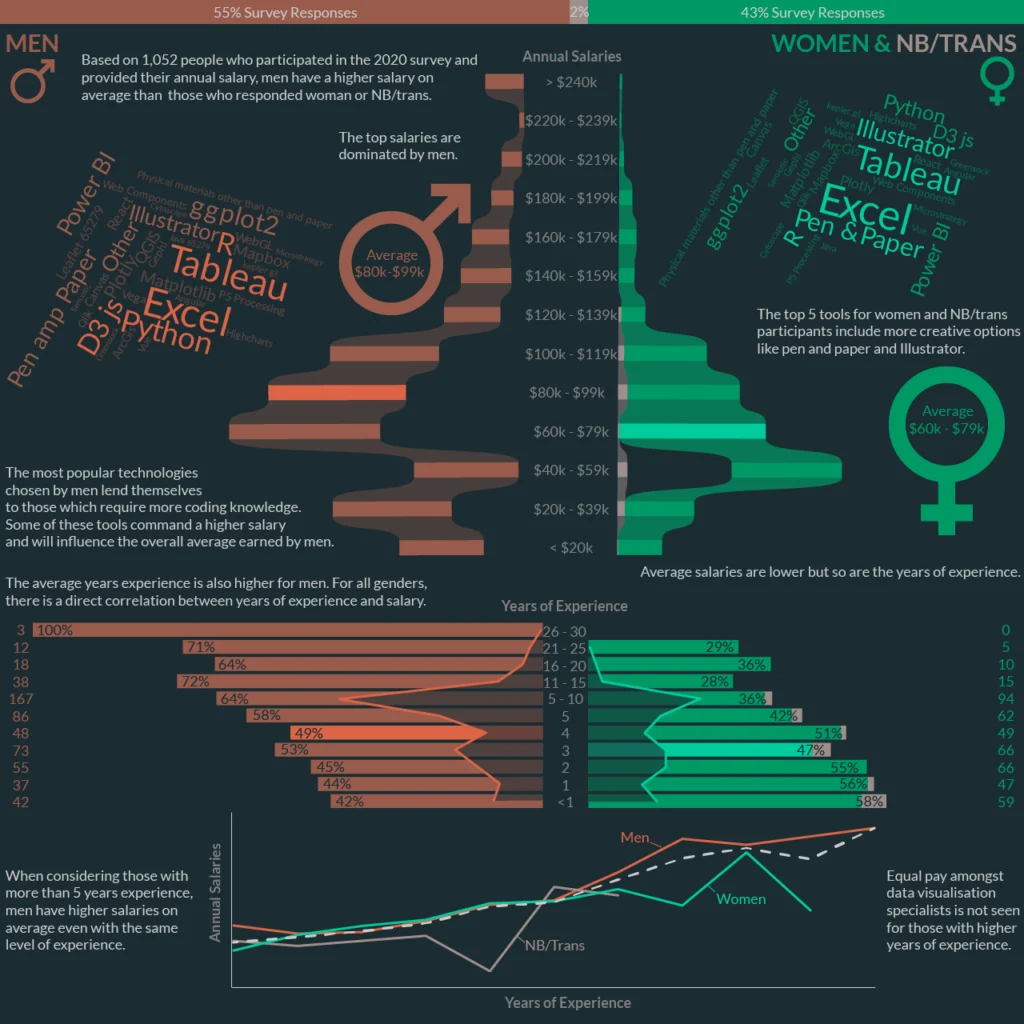
Gender Equality in Data Visualisation Salaries.
DVS Census, explanatory
Claire Rymarz
A comparison of annual salaries by gender to explore if there is equality in the data visualisation community. Using 2020 survey responses who provided gender,…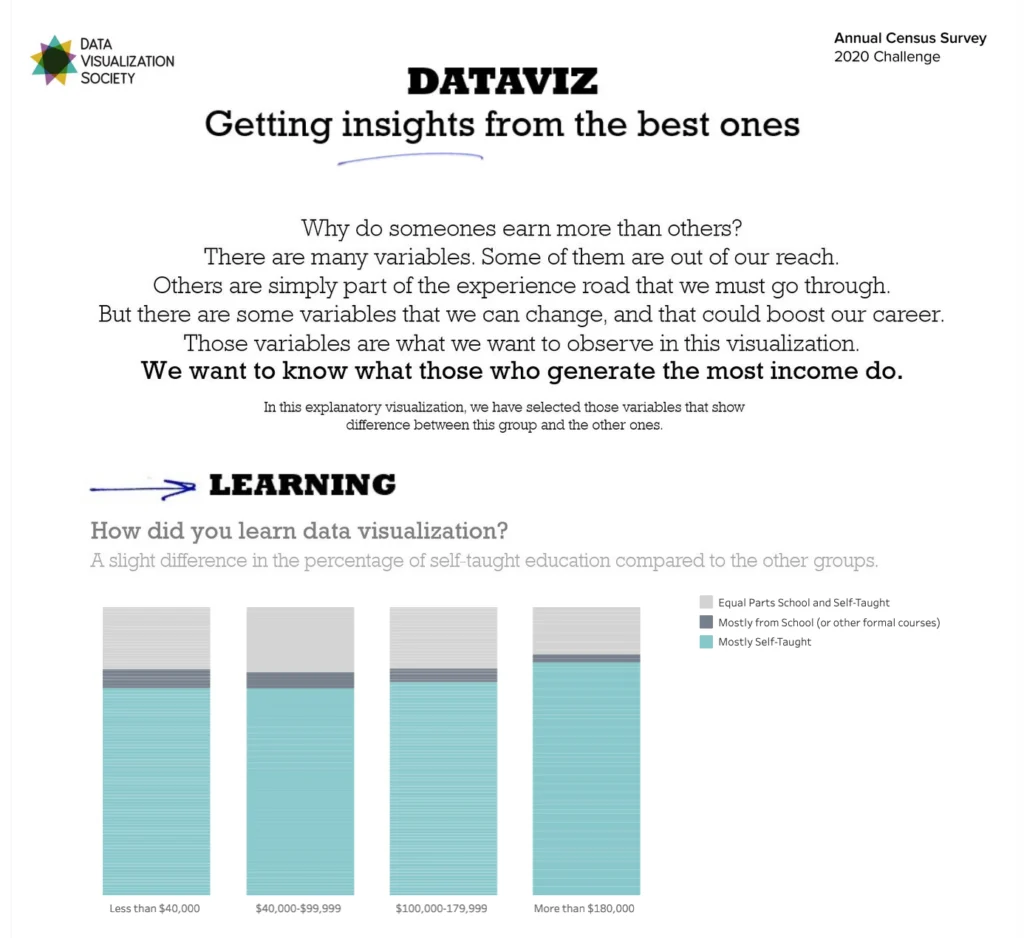
Getting insights from the best ones
DVS Census, explanatory
María Soledad Molinete
This explanatory visualization looks at the variables that shows different behavior depending on yearly pay. https://public.tableau.com/profile/sole.molinete#!/vizhome/Visualization_SocietySoleMolinete/Dashboard1?publish=yes Created by María Soledad Molinete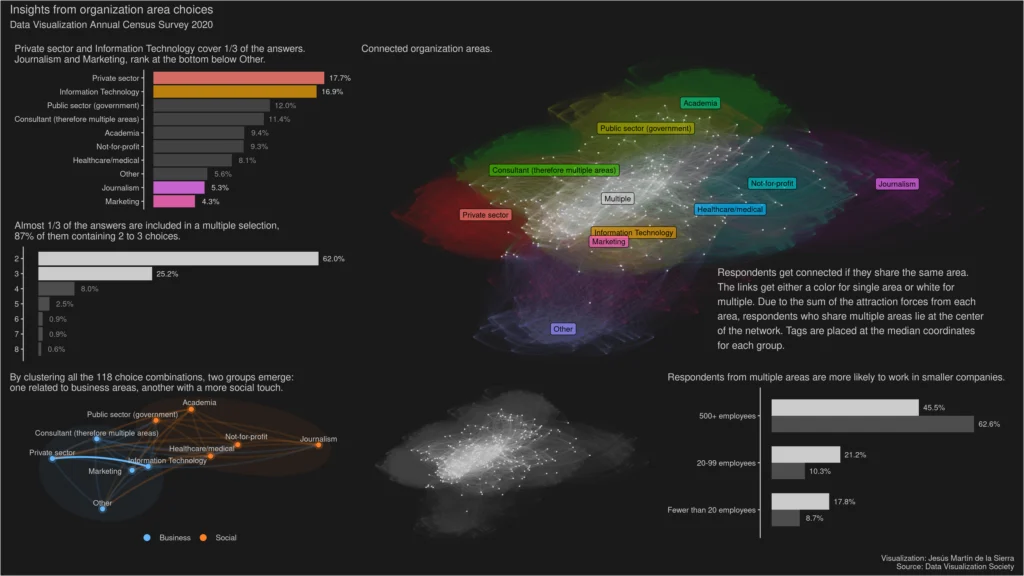
Insights from organization area choices
DVS Census, explanatory
Jesús Martín de la Sierra
This visualization explores the multiple choice question concerning the organization area where the people are working in. First, the absolute frequencies for each area is…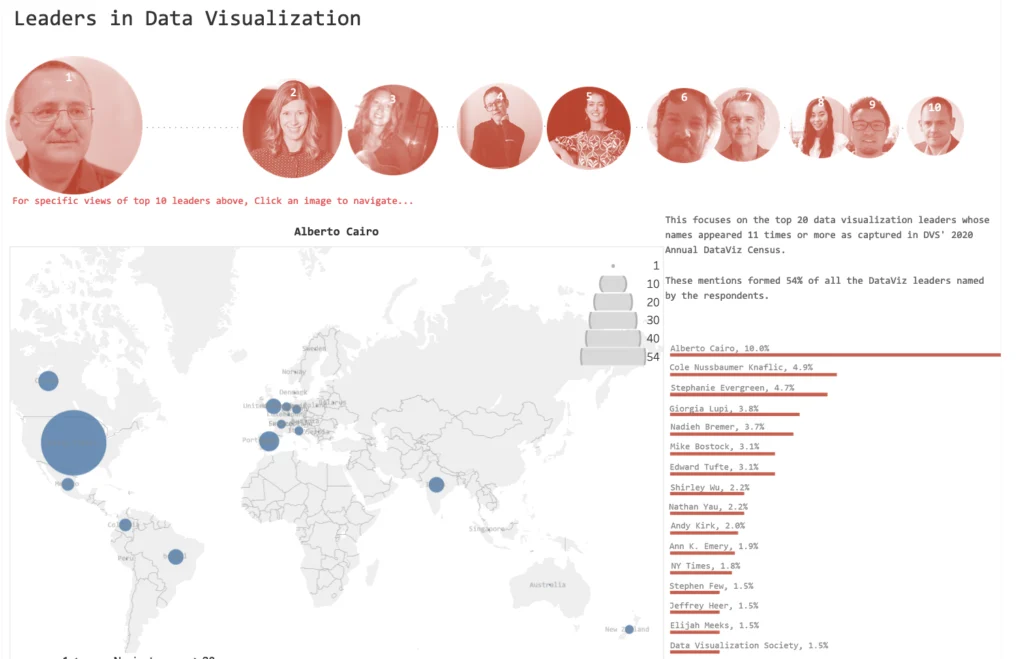
Leaders in Data Visualization
DVS Census, explanatory
Denis Owor
Continent and Country geographic focus of the top 20 data visualization leaders whose names appeared 11 times or more as captured from DVS's Annual DataViz…
Making Gain$ in Data Viz
DVS Census, explanatory
Krista Chan
Stacked bar charts which explore how salary changes with years of experience for data viz professionals. Charts are faceted by gender, being from a historically…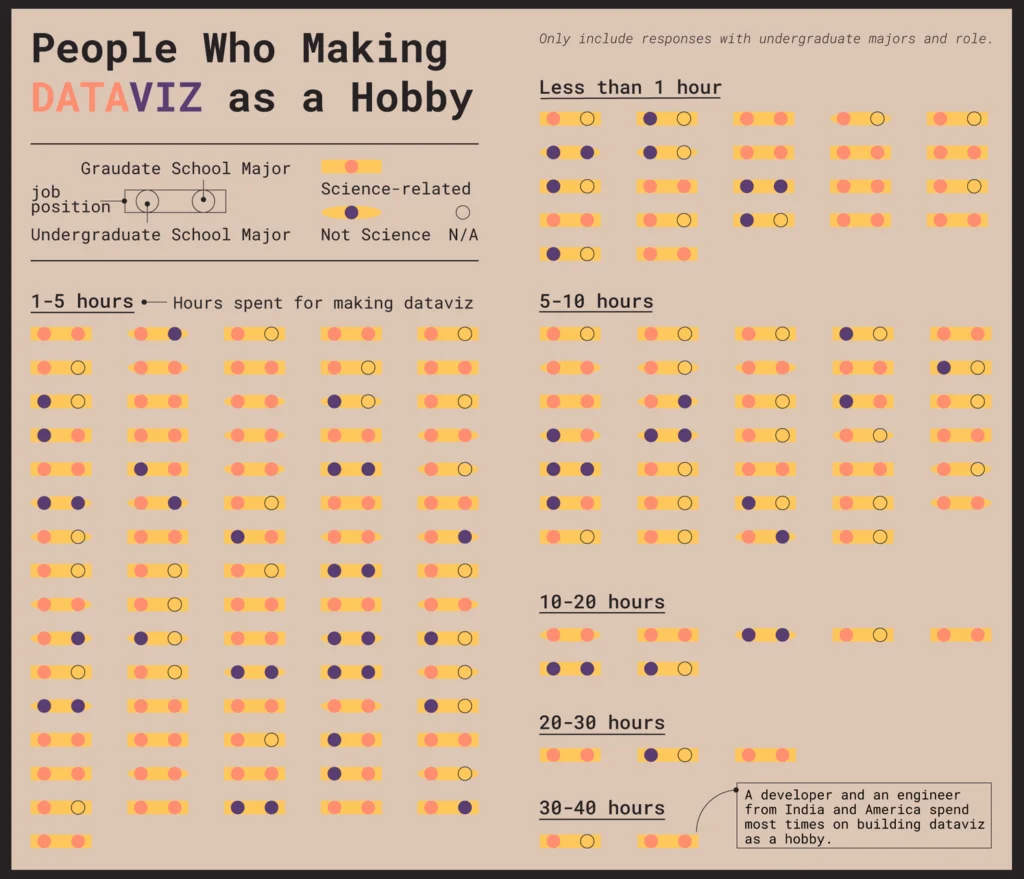
People who making DataViz as a hobby
DVS Census, explanatory
Mandy Zou
Trying to see what kind of people are making data visualization as a hobby. Since I came across data visualization from the journalism field, it…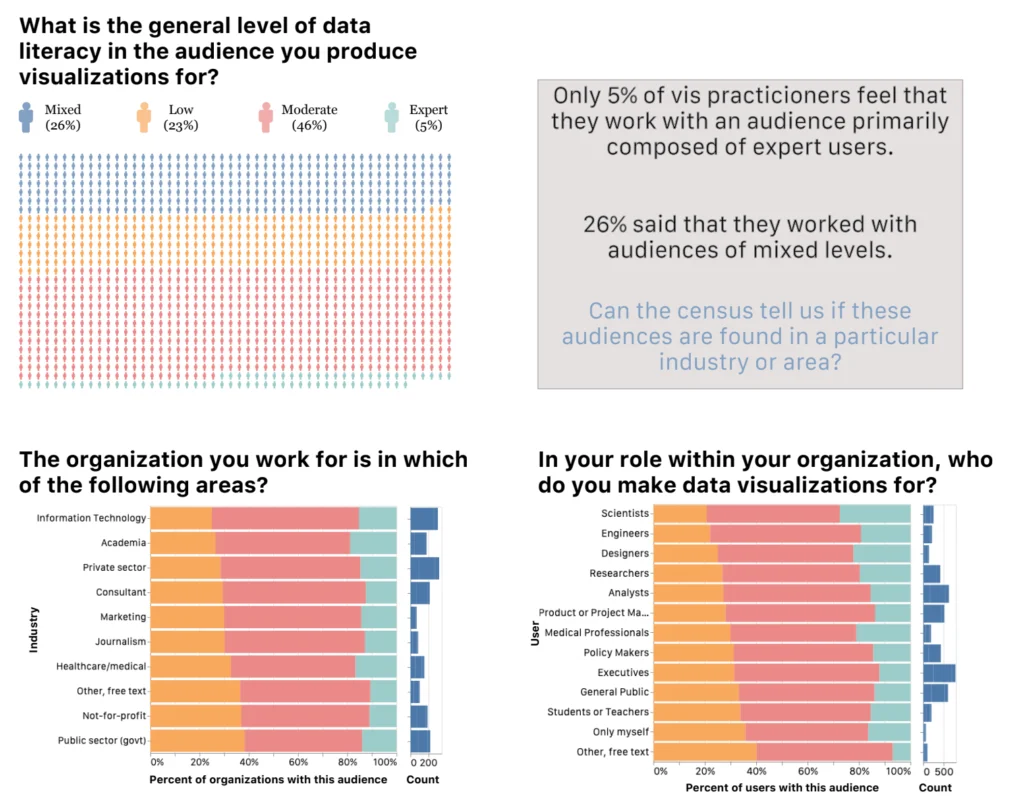
State of the Audience
DVS Census, explanatory
Matt Britton
A visualization exploring the data literacy of vis audiences https://drive.google.com/file/d/1PinhgAsxhf6YbfnE3dLaUMemwuzaBgyk/view
Technologies for Data visualization
DVS Census, explanatory
Supriya Dutta
This data narrative tries to analyze what impacts the usage of Technologies for Data Visualization. https://drive.google.com/file/d/1qGiDH_Q4HclxAp_ArIrwWdi2XZhxO8vp/view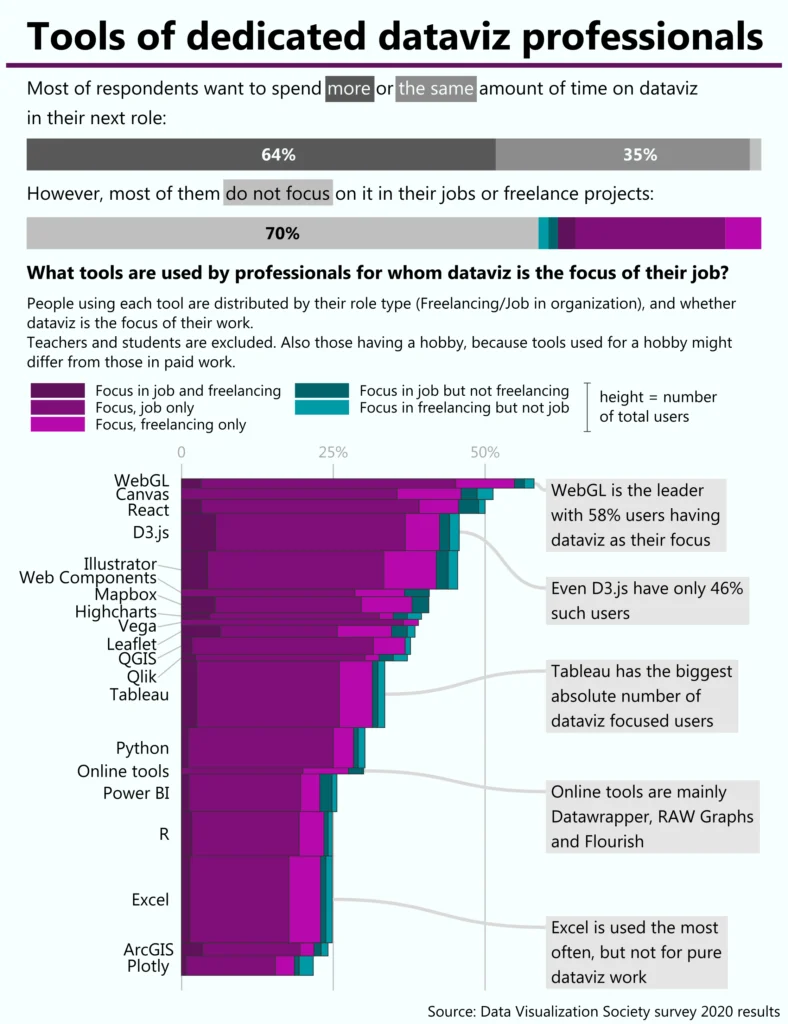
Tools of dedicated dataviz professionals
DVS Census, explanatory
Martynas Jočys
There are variety of tools to do dataviz and for someone who is just starting it is quite difficult to select which one to learn.…
Under- and Over-representation of Countries in the DVS 2020 Census
DVS Census, explanatory
Virginia Chen
My visualization shows the relative under- and over-representation of different countries in the 2020 census survey. I used the most recent 2020 country population estimates…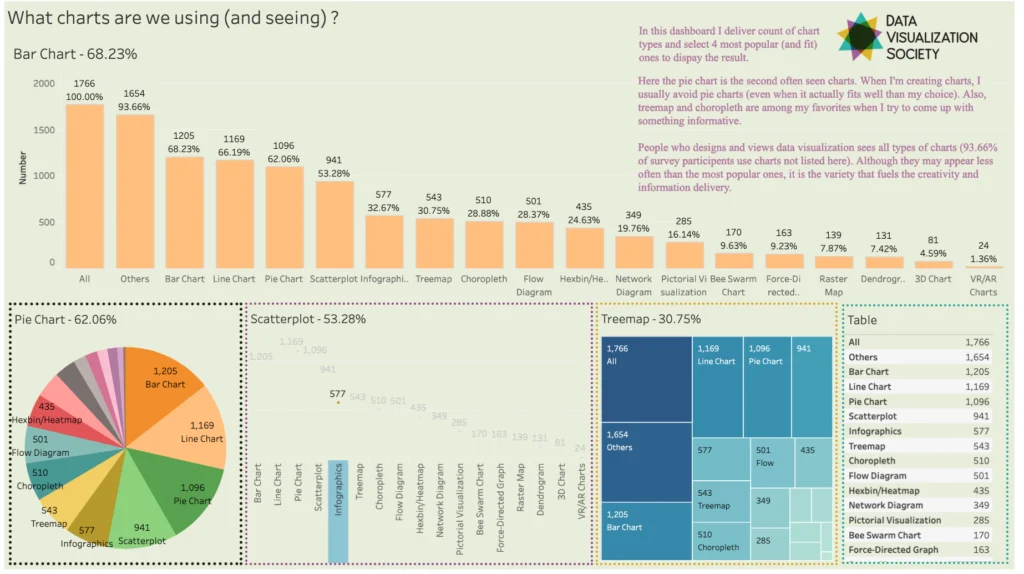
What charts are we using?
DVS Census, explanatory
Runge Yan
My initial idea is to use the charts mentioned in the survey to give viewers a sense that why certain charts are popular. It appears…Who is Looking for Work?
DVS Census, explanatory
Laura A. Davenport
Turnover is costly to organizations. In an effort to understand DVS members who are looking for work, I reported some basic demographic characteristics. In addition,…