SOTI Challenge 2023

The 2023 State of the Industry Survey Challenge winners have arrived!!
There are first, second, and third place winners for both exploratory and explanatory visualizations and a winner for the beauty category (all highlighted below).
EXPLORATORY DATA VISUALIZATION
The most useful exploratory visualization. We want to see dashboards and other visualizations that let people generate and test their hypotheses about what motivates and affects the field.
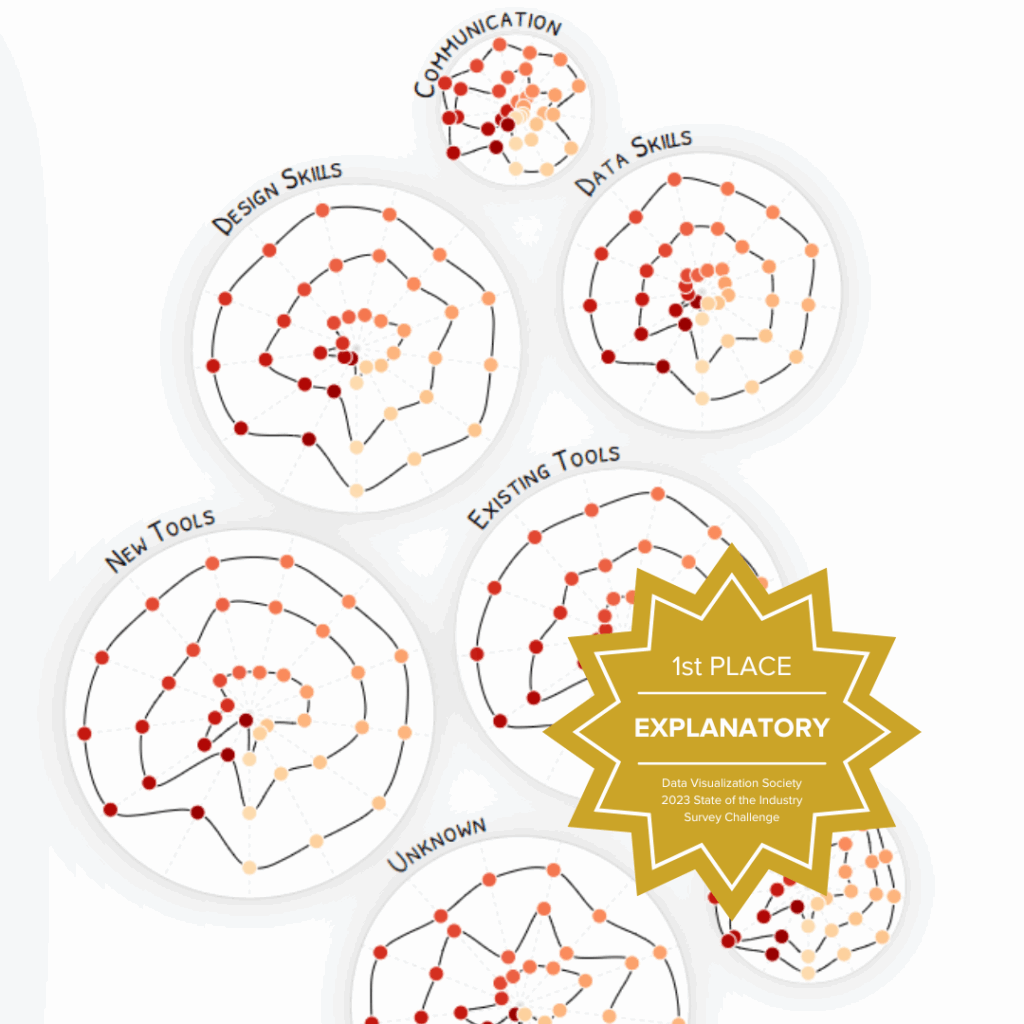
EXPLANATORY DATA VISUALIZATION
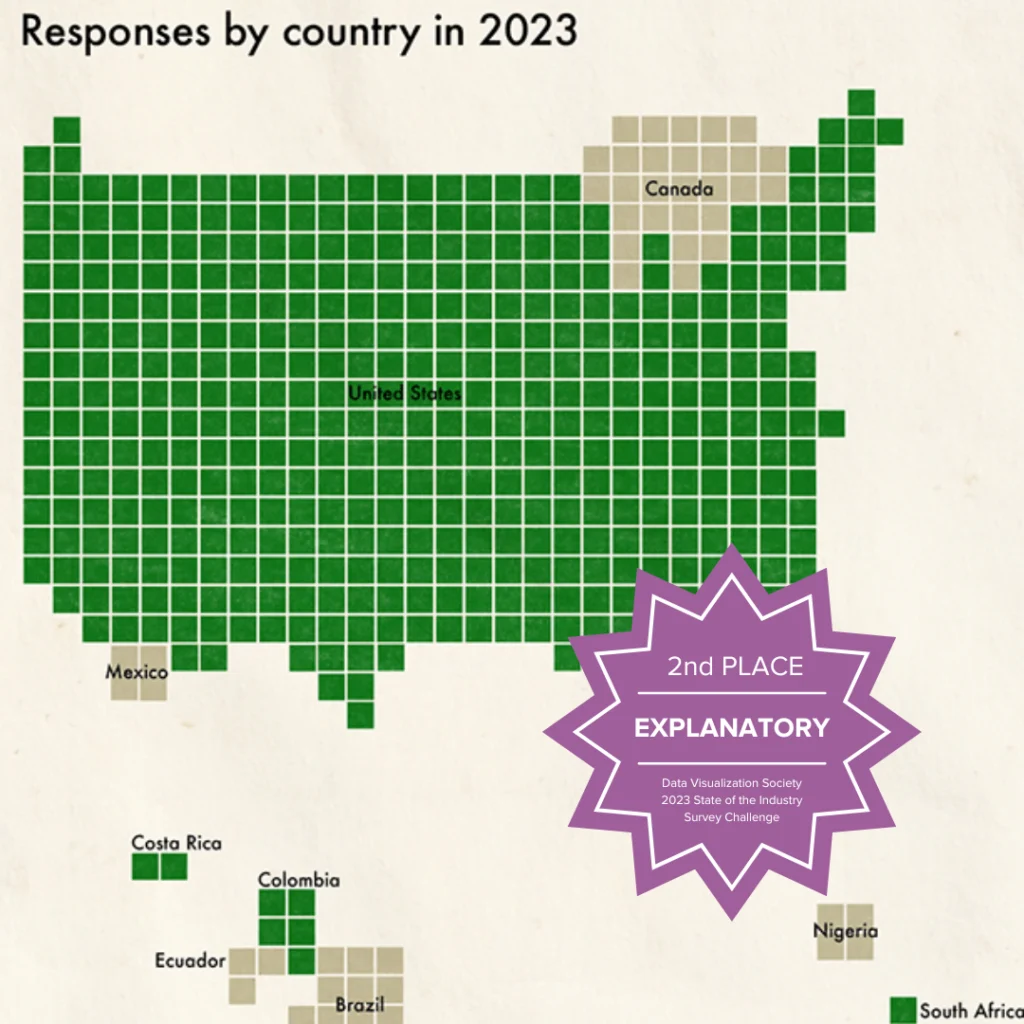
The most engrossing explanatory visualization. We want to see the trends in the data and how they weave together to tell us what’s happening in the data viz community.
DATA
The 2023 Data Visualization SOTI Survey has responses to 60+ questions and was taken by over 800 people. It covers professional details like roles and tasks, tools and charts, experience, compensation, work contexts, challenges and changes, and more.
Rules
- Each person can only enter two submissions and only one submission for each category.
- Entries are open to Data Visualization Society members. If you are not a member, it’s easy and free to join. Sign up here.
- Groups can enter but any cash-value prize will be awarded to the individual submitting the entry. Any group entry must be a list of names and cannot be an organization. Gallery space + online ribbons can be shared by all group members named.
- You must use the 2023 Annual State of the Industry Survey Data. You are also welcome to use annual survey data from previous years or other relevant datasets. If you use any additional datasets, they need to be cited.
- Any work presented must be your own.
- By entering you give DVS the non-exclusive right to publish your work and/or screenshots of it. (Examples of use: social media, website, emails and reports)
- All work must adhere to the DVS Code of Conduct.
- DVS board members, advisory committee, judges and their immediate family are not eligible to win prizes. However, they may enter and be included in the full gallery.
- The Data Visualization Society reserves the right to not award a prize for a category.
Submissions
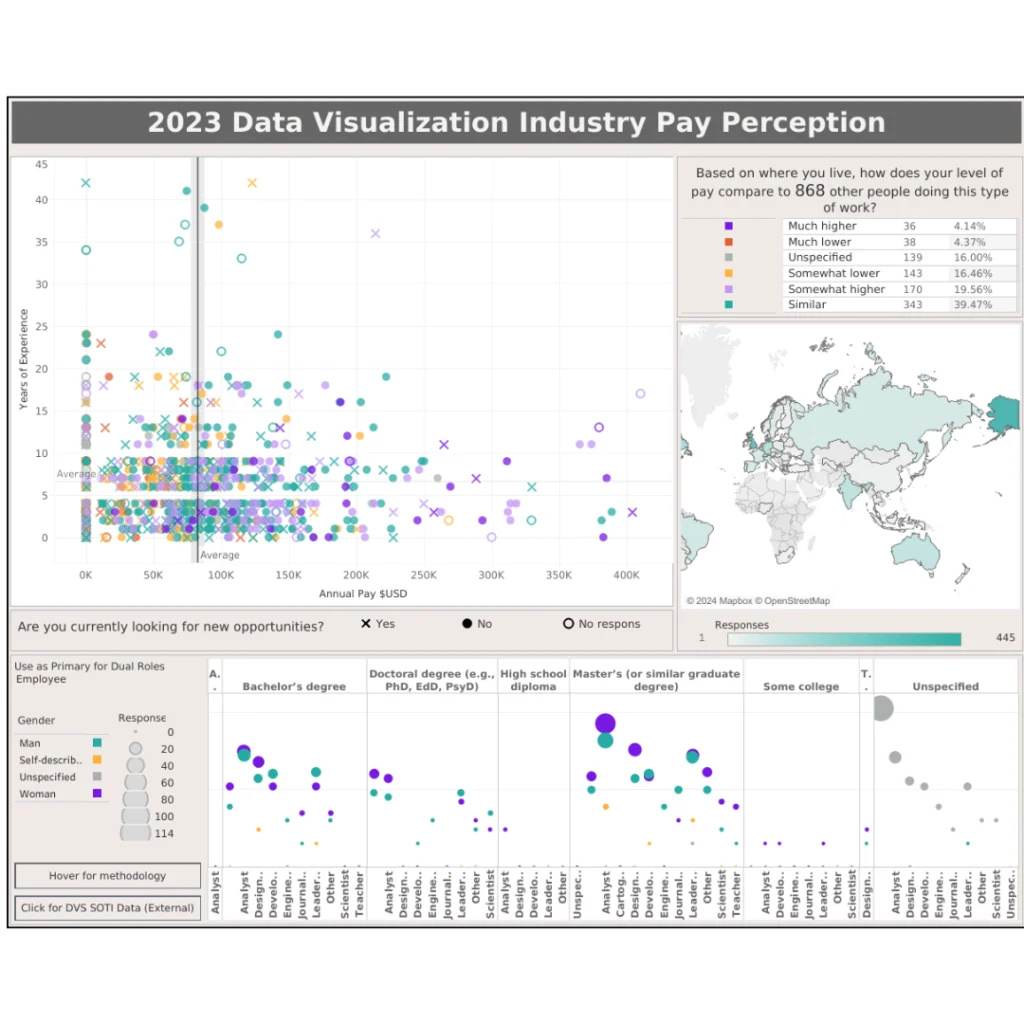
2023 Data Visualization Industry Pay Perception
2023 SOTI RESULTS, ISOTYPEd

Aligning Ambitions with Realities: Mapping Practitioners’ Priorities & Challenges

Artificial Intelligence Adoption by Data Visualization Professionals

Average Annual Pay Based on Employee Role
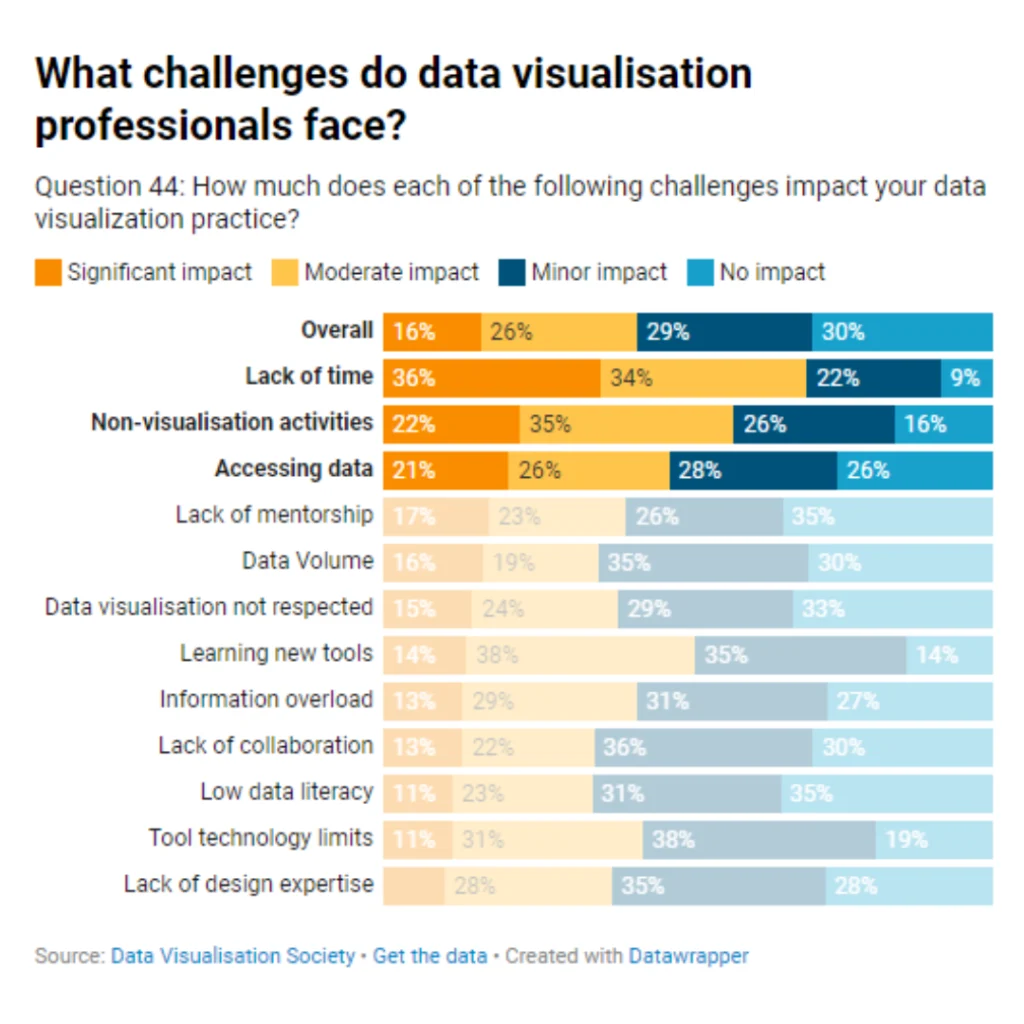
Challenges faced by the data visualisation community

Challenges for data visualization practice

Data Scientist
Data Visualization Challenges and Inspirations
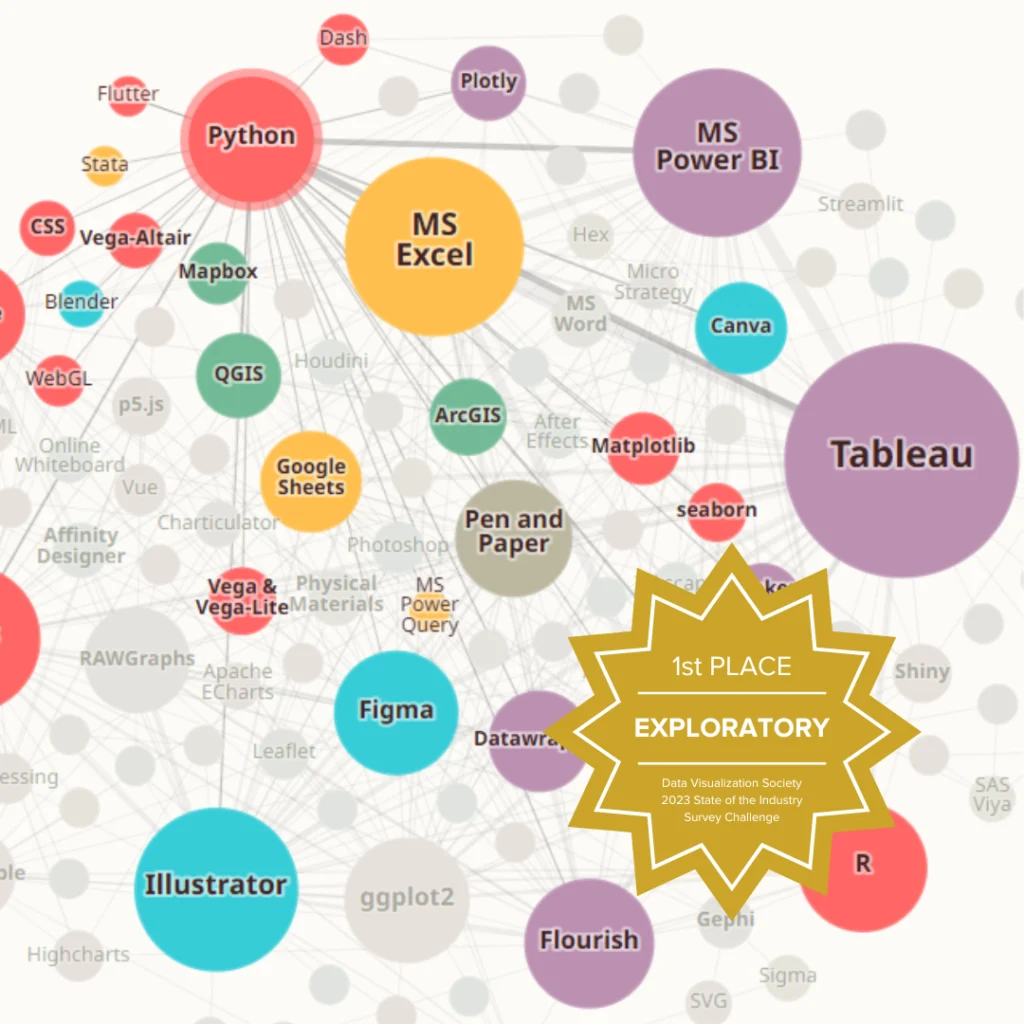
Dataviz Tools Network

DVS Survey: Income Trends Among DataViz Professional

Employee vs Freelance: Audiences, Charts and Communications

From Bar Graphs to Instagram Stories: Tracking the Evolution of How Data Visualization Professionals Present Data

The Caterpillars of the Dataviz Experience

The Data Viz Tools We Used In 2023
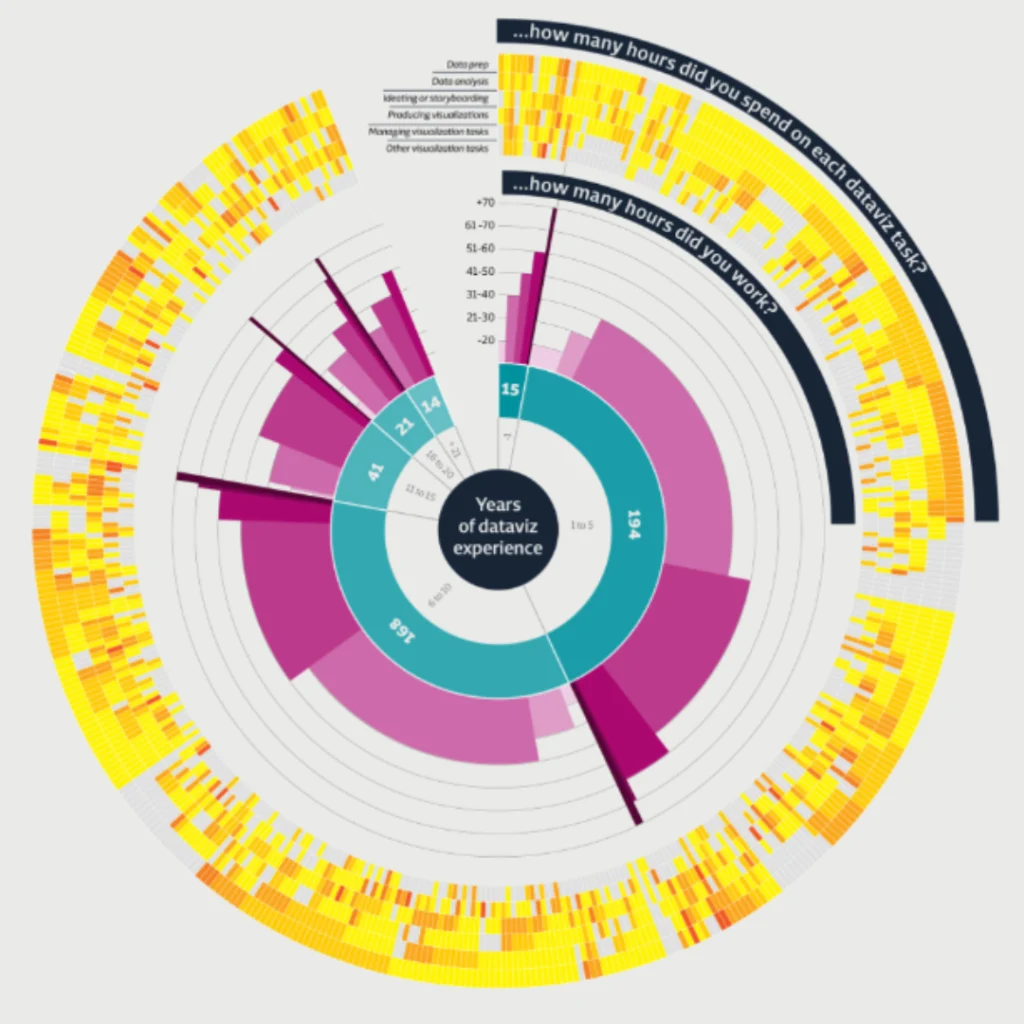
The dataviz clock

The Gender Pay Gap in Data Visualization

The tools we use for data visualization

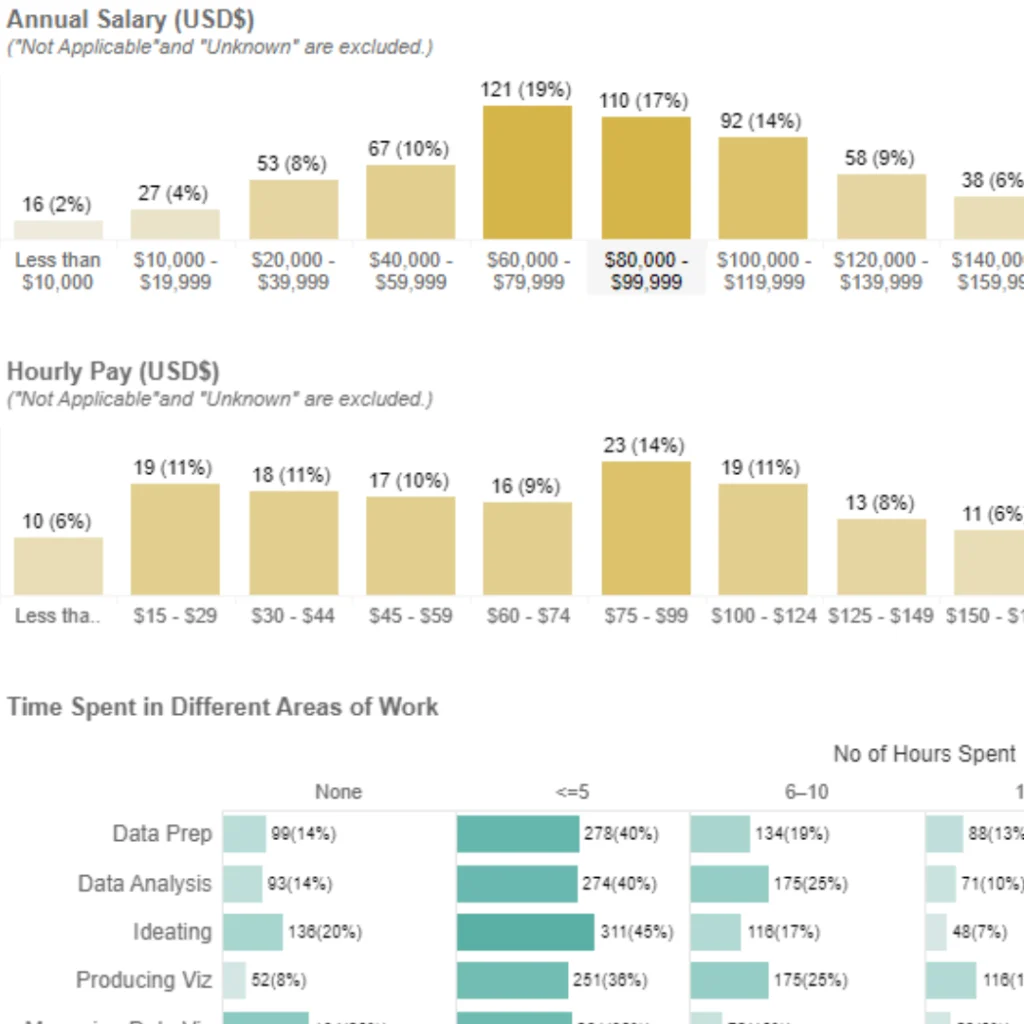
Unveiling the Salary Spectrum

What are data visualisation practitioners’ favourite tools?