Visualize the Membership – 1 month
The signup patterns of the first 3,500 members
We provided the data, you provided the visuals! Submissions from the first Data Visualization Society’s challenge are featured in the gallery below.
Submissions
2D t-SNE Plots
Member Data
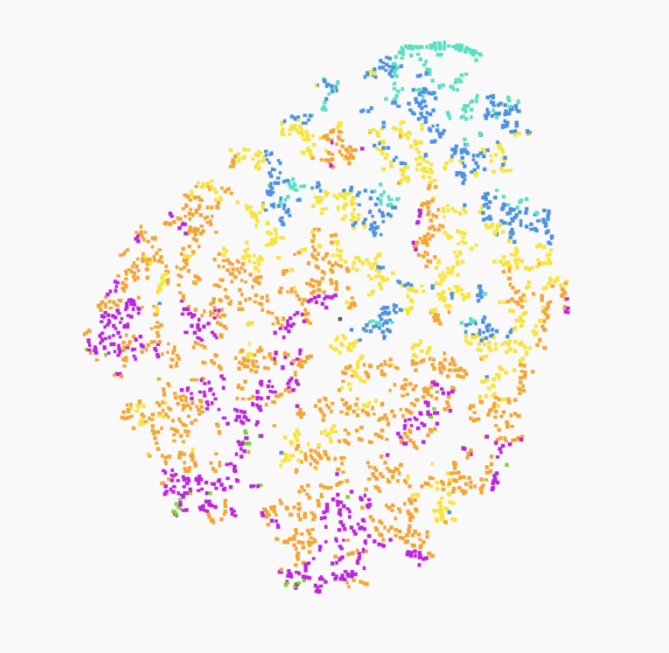
Dan McCarey, Maptian
CREATED BY: Dan McCarey, Maptian DESCRIPTION: I created these t-SNE plots using the aggregate score for each category and the hour of sign up. PROCESS…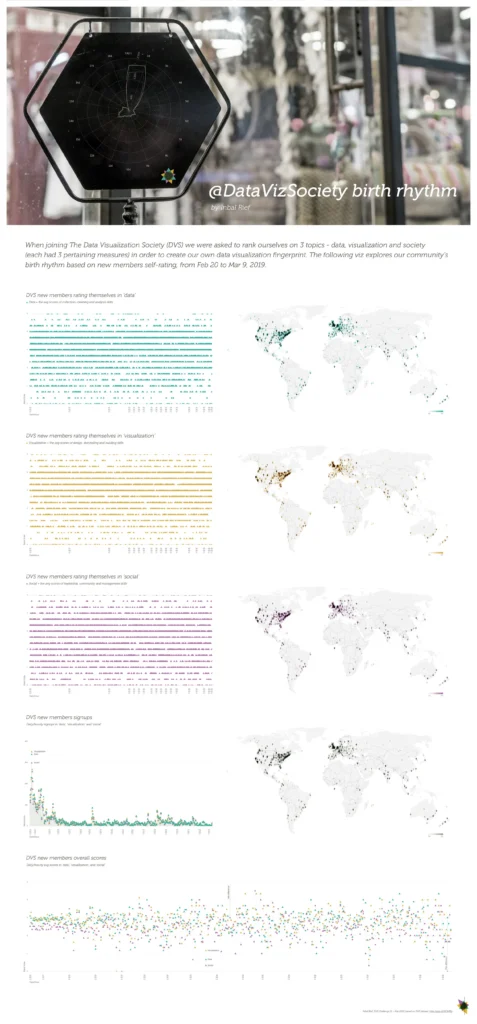
@DataVizSociety birth rhythm
Member Data
Inbal Rief, Desualizer
Created by: Inbal Rief, Desualizer Description: When joining The Data Visualization Society (DVS) we were asked to rank ourselves on 3 topics - data, visualization…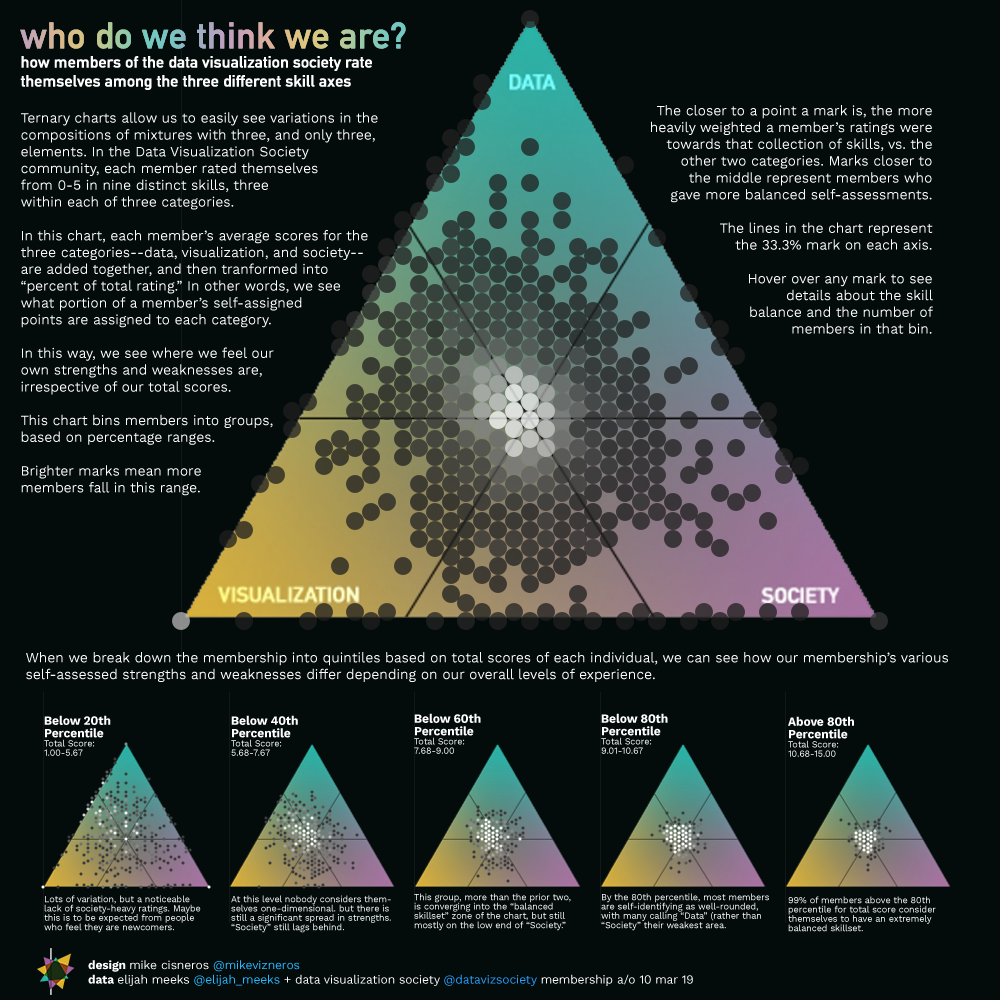
Balance
Member Data
Mike Cisneros
Created by: Mike Cisneros (@mikevizneros) Description: A ternary chart showing where members' self-assessments reveal their perceived strengths and weaknesses. Process for Creation: I saw the…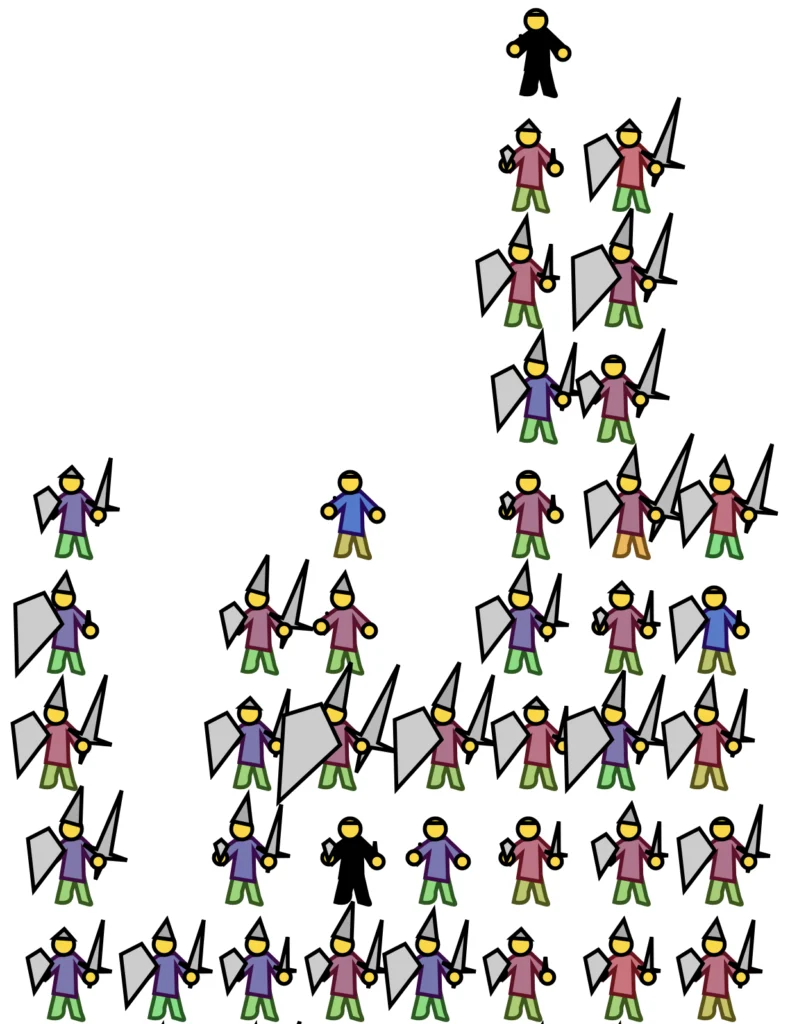
Chernoff Adventurers
Member Data
Elijah Meeks
Created by: Elijah Meeks Description: Each member is represented by a single adventurer icon. Pants color encodes the latitude of the member's location while shirt…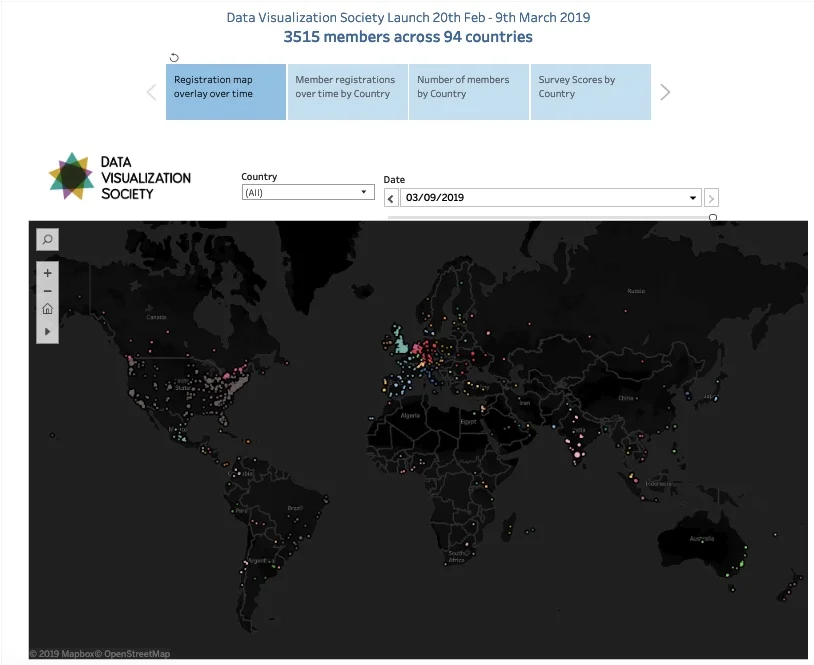
Data Visualization Society Launch
Member Data
Wendy Small
Created by: Wendy Small Description: The growth of members each day during the launch and how each country scored in the membership survey questions surrounding…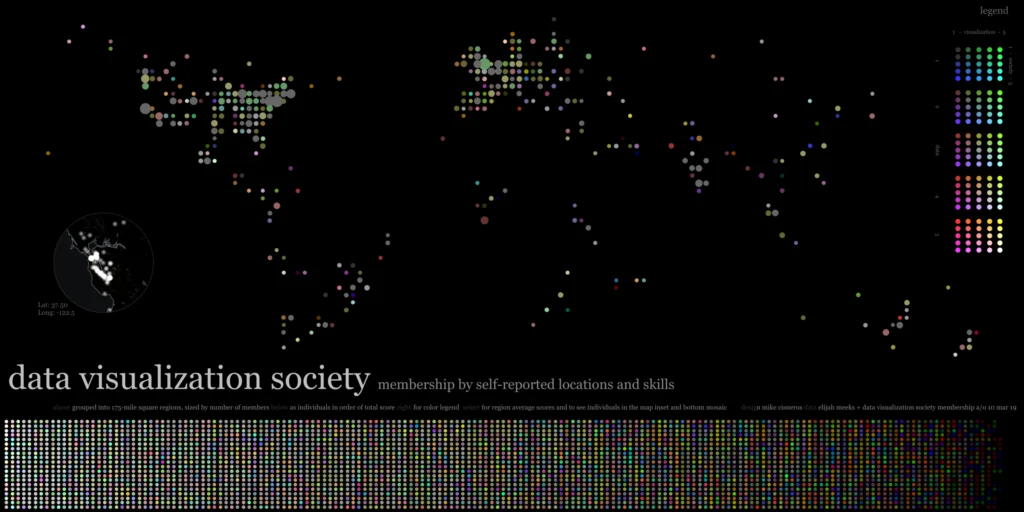
Data Visualization Society Membership
Member Data
MIKE CISNEROS
Created by: MIKE CISNEROS (@MIKEVIZNEROS) Description: A gridded map of the world using RGB values to denote each location's relative balance of data, visualization, and…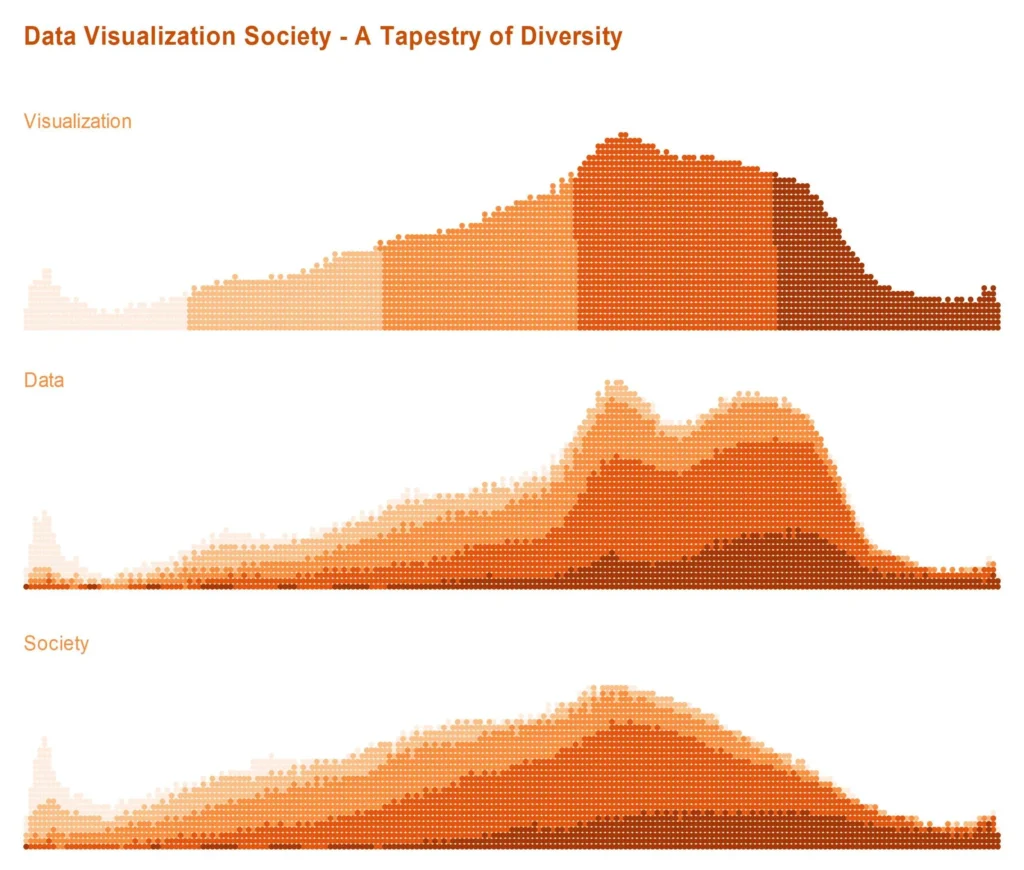
DVS – A Tapestry of Diversity
Member Data
Daniel Zvinca
CREATED BY: Daniel Zvinca DESCRIPTION: This is, imo, a refined version of the original post, with the same message, DVS is heterogeneous. If the original…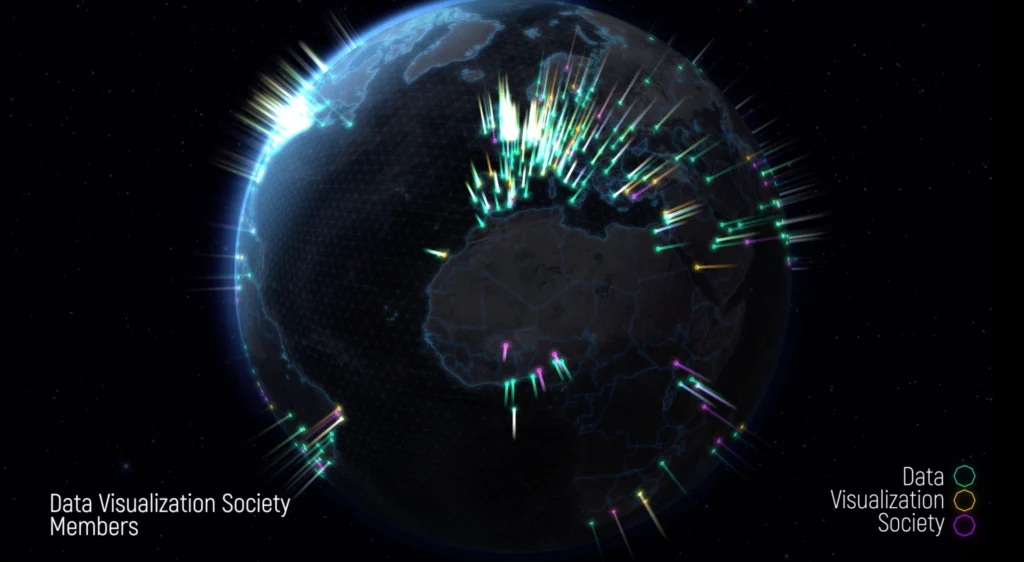
DVS Global Members
Member Data
Craig Taylor - Ito World
CREATED BY: Craig Taylor - Ito World DESCRIPTION: An animated rotating globe of all DVS members. Spike flare is coloured by users strongest skill. PROCESS…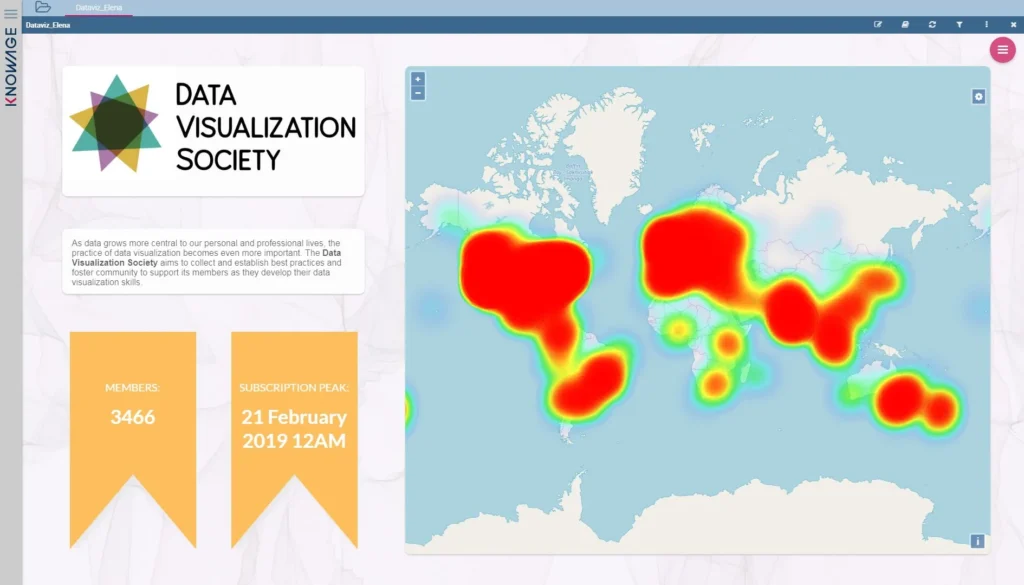
DVS hotness
Member Data
Elena Marchisa
CREATED BY: @emarchisa; @knowage_suite; www.knowage-suite.com DESCRIPTION: Interactive cockpit on DVS subscribers worldwide PROCESS FOR CREATION: I uploaded the DVS csv file as dataset. Then I…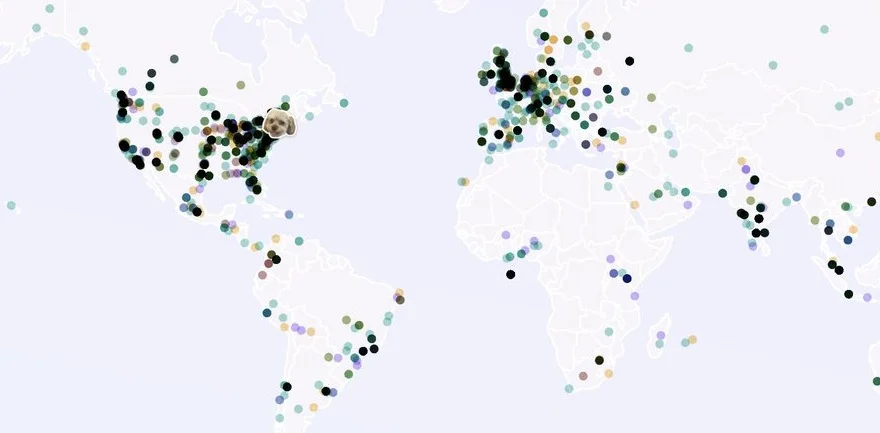
DVS Sign-up Map
Member Data
Marguerite Roth
CREATED BY: Marguerite Roth DESCRIPTION: A world map showing DVS member sign-ups based on member location and highest ranked skill category. The dog head positioning…
DVS Subtractive Colours
Member Data
Kenneth Field
CREATED BY: Kenneth Field (@kennethfield) DESCRIPTION: Offset proportional symbols sized relative to member's self reported expertise. Overlaps create zones of increased expertise. All mapped using…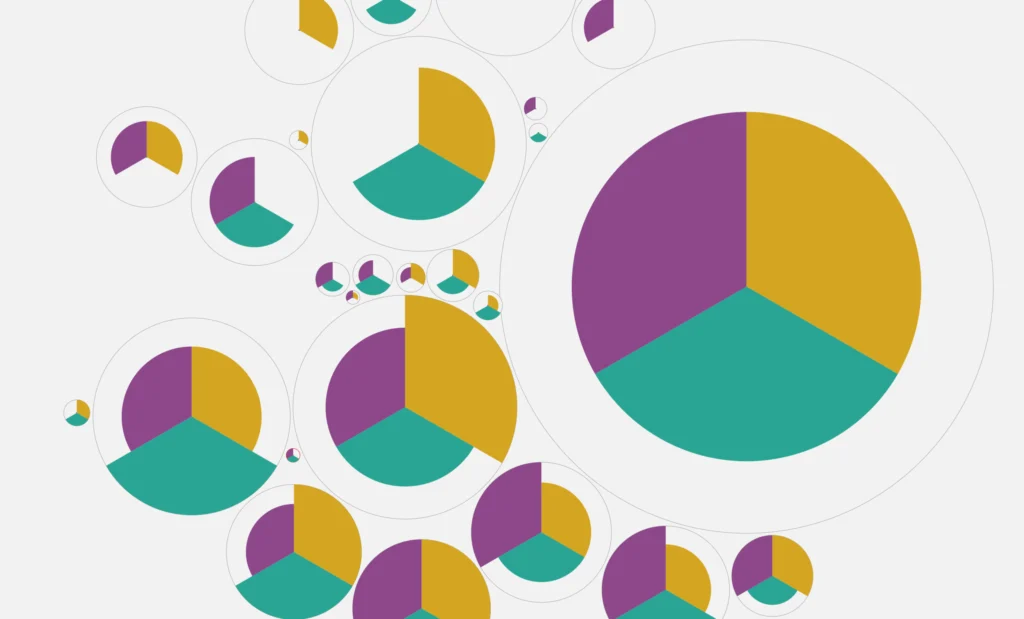
DVS, SVGs and Privacy
Member Data
Adam Pearce
CREATED BY: Adam Pearce DESCRIPTION: force directed pies illustrate how combining the contest data with badge SVGs reveal more about some members than the organizers…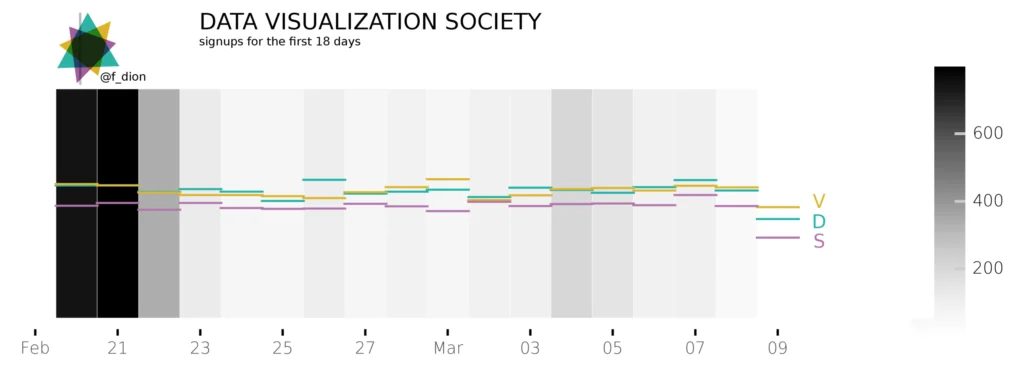
DVS, the first 18 days
Member Data
Francois Dion
CREATED BY: Francois Dion - fdion@dionresearch.com DESCRIPTION: 1D heatmap representing the daily signups, along with the average daily score for Data, Visualization and Society. PROCESS…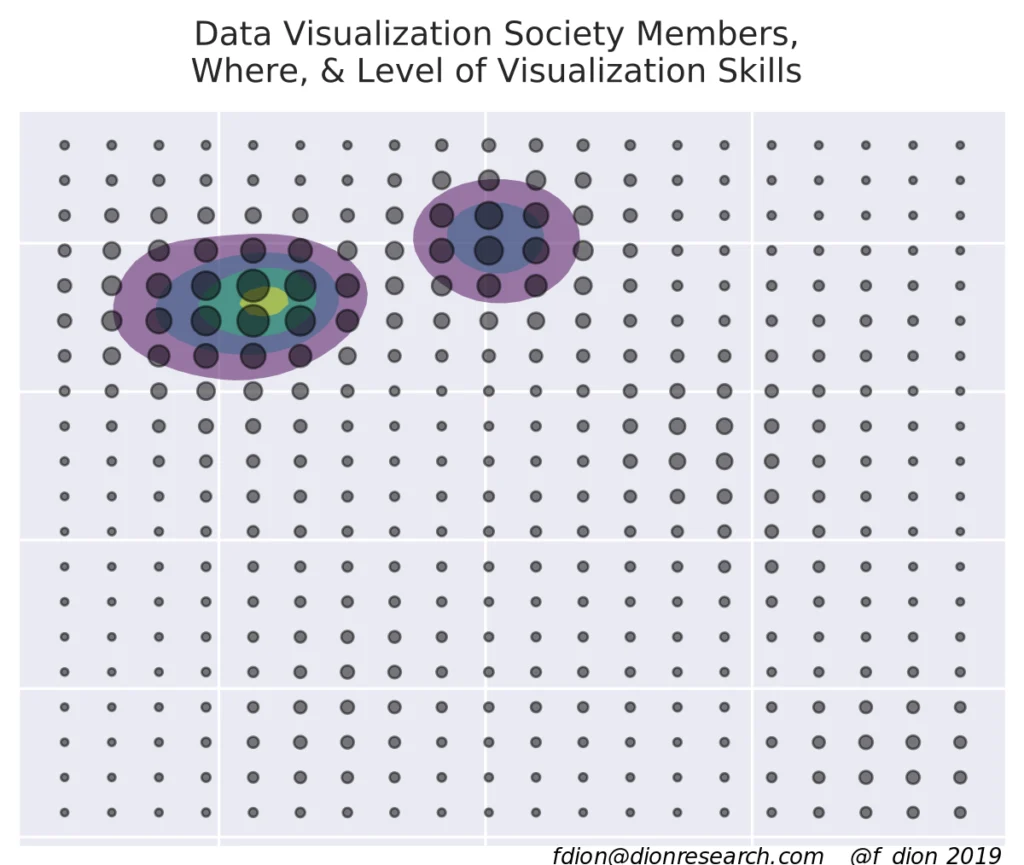
DVS, Where & Level of Visualization Skills
Member Data
Francois Dion
CREATED BY: Francois Dion - fdion@dionresearch.com DESCRIPTION: Map without a basemap. Regional level of individuals with visualization skills as a two dimensional isometric density estimation,…
DVS-WebChart
Member Data
c-c-l
CREATED BY: @c-c-l DESCRIPTION: Number of members of the DVS sorted by continent
Heatmap View using Clustergrammer2
Member Data
Nicolas Fernandez
CREATED BY: Nicolas Fernandez DESCRIPTION: We visualized the high-dimensional member data using our in-development interactive WebGL heatmap Jupyter widget called Clustergrammer2. Users are visualized as…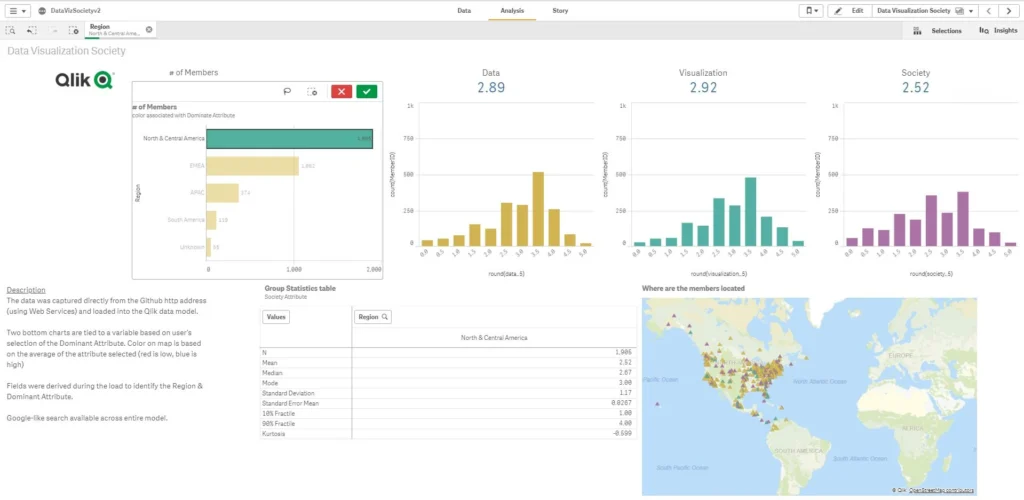
Interactive Dataviz with Mobile
Member Data
Paul Van Siclen
Created by: Paul Van Siclen Description: The data was captured directly from the Github http address (using Web Services) and loaded into the Qlik data…
Interactive Exploration of the First DVS Signups
Member Data
Philipp Koytek
CREATED BY: Philipp Koytek (@p4dataviz) DESCRIPTION: My goal for this challenge was to make an interactive and explorative visualization, so please feel free to explore:…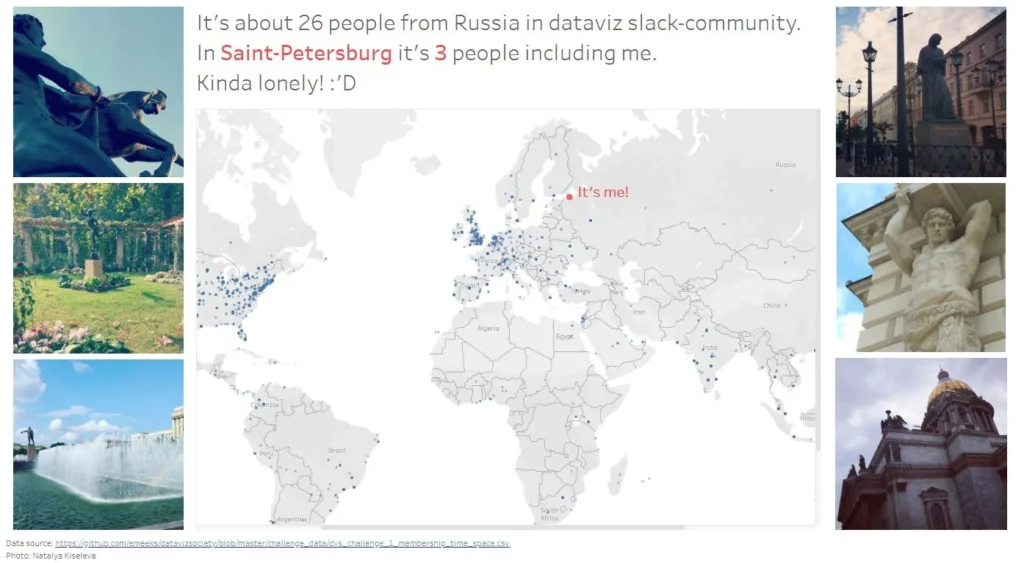
Loneliness in beautiful city
Member Data
Natalia Kiseleva
Created by: Natalia Kiseleva Description: Simple viz about geographical location of community members with photos and a simple message. Process for Creation: I'm newbie in…
Musical map
Member Data
John Tibbutt
CREATED BY: John Tibbutt (@tibbuttj) DESCRIPTION: Animated map of sign ups over time. Each time a dot lands on the map a note is played.…
Needlessly Spinning Quantile Dotplots
Member Data
Alex Wein
CREATED BY: Alex Wein PROCESS FOR CREATION: ggplot2, Figma, and css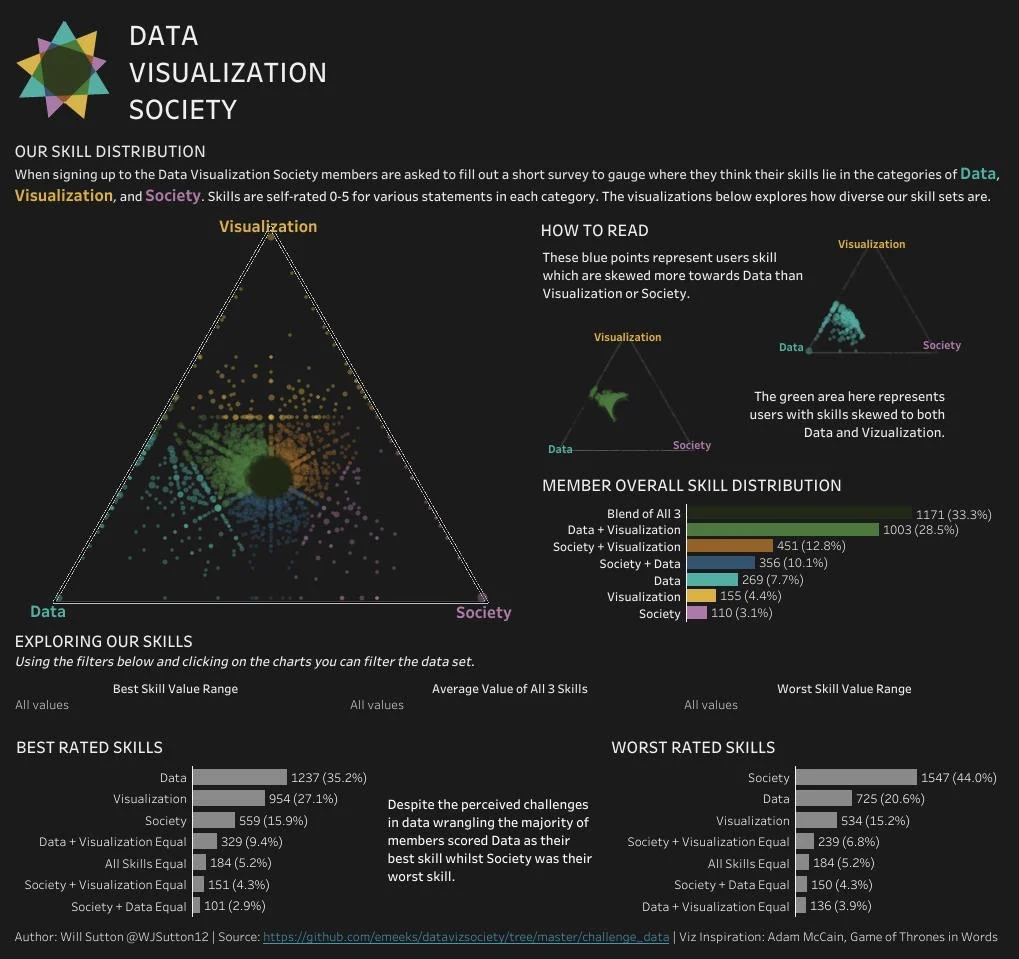
Our Skill Distribution
Member Data
@wjsutton12
Created by: @wjsutton12 (instagram) @WJSutton12 (twitter) Description: An exploratory data analysis piece on the range of skill of DVS members Process for Creation: I thought…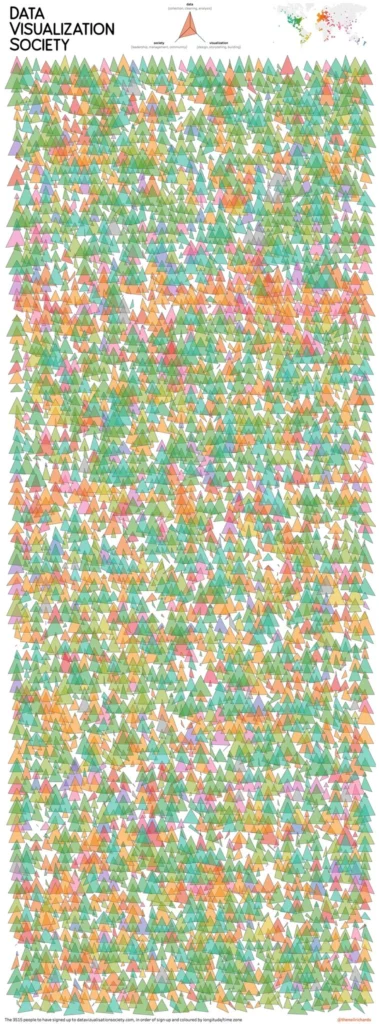
See the Forest for the Trees
Member Data
Neil Richards
CREATED BY: Neil Richards (@theneilrichards) DESCRIPTION: A small multiples visualisation depicting each of the first 3515 signups to datavisualizationsociety.com PROCESS FOR CREATION: https://questionsindataviz.com/2019/03/20/does-it-matter-if-shapes-overlap-in-a-visualisation/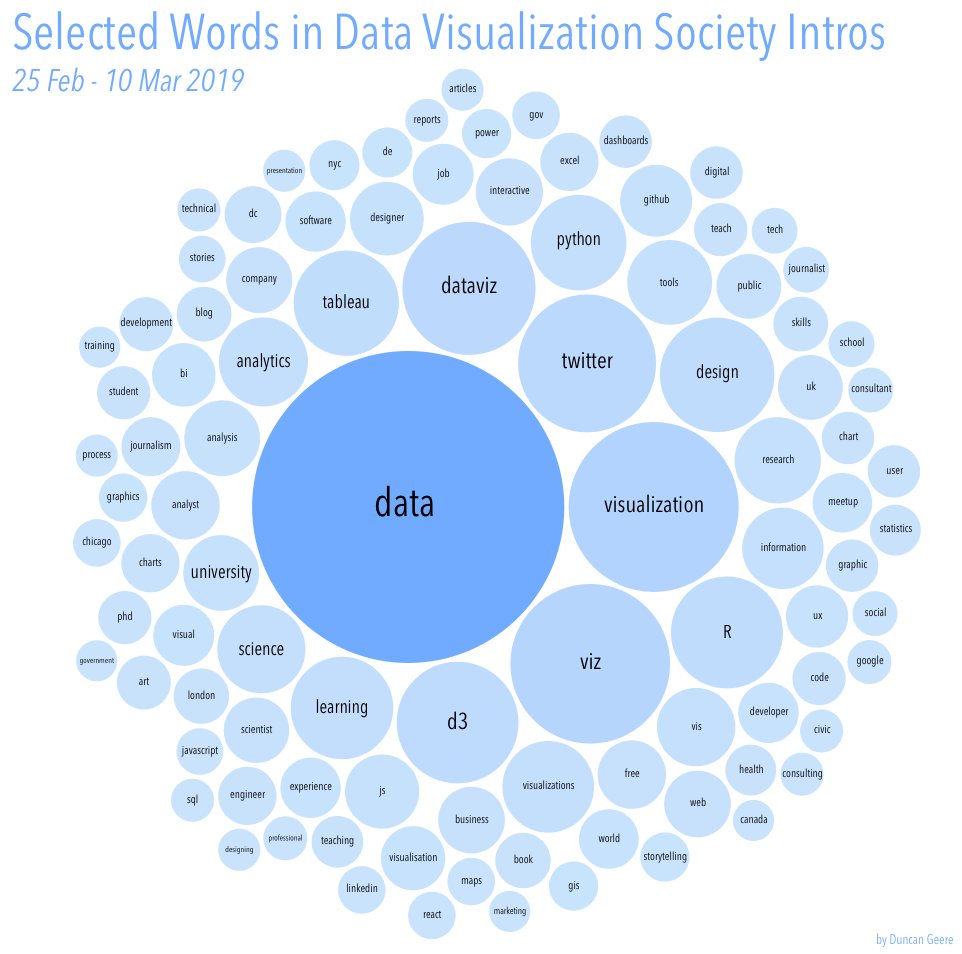
Selected Words in DVS Intros
Member Data
Duncan Geere
Created by: Duncan Geere Process for Creation: Data analysis in Pandas, visualization in Rawgraphs and Illustrator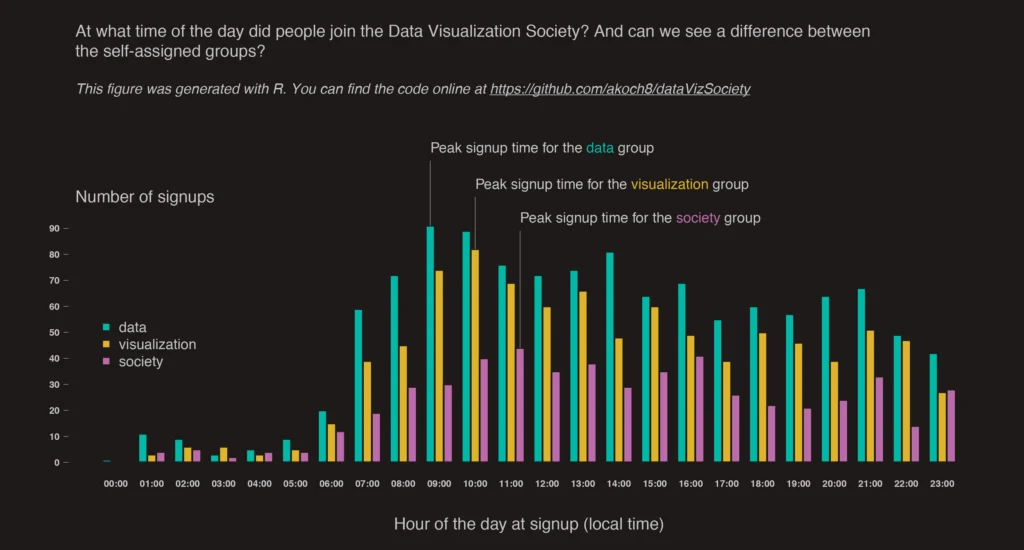
Signup time
Member Data
Alexander Koch
CREATED BY: Alexander Koch DESCRIPTION: At what time of the day did people join the Data Visualization Society (DVS)? And can we see a difference…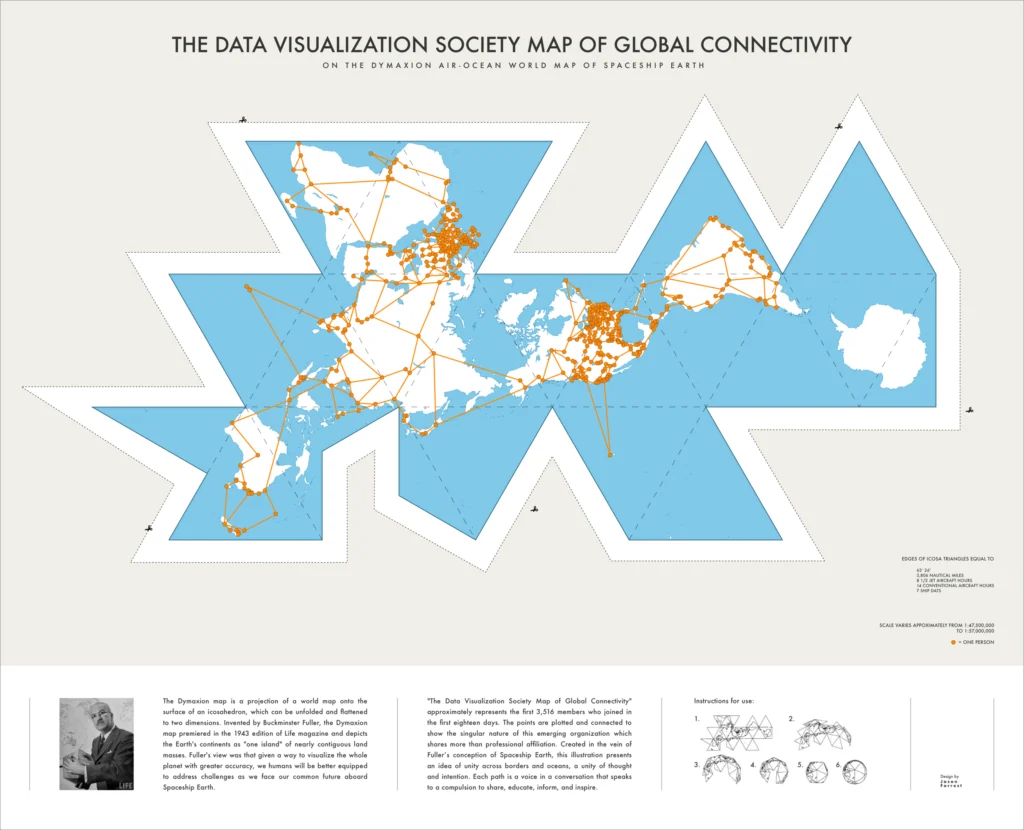
The Data Visualization Society Map of Global Connectivity
Member Data
Jason Forrest
Created by: Jason Forrest Description: “The Data Visualization Society Map of Global Connectivity” approximately represents the first 3,516 members who joined in the first eighteen…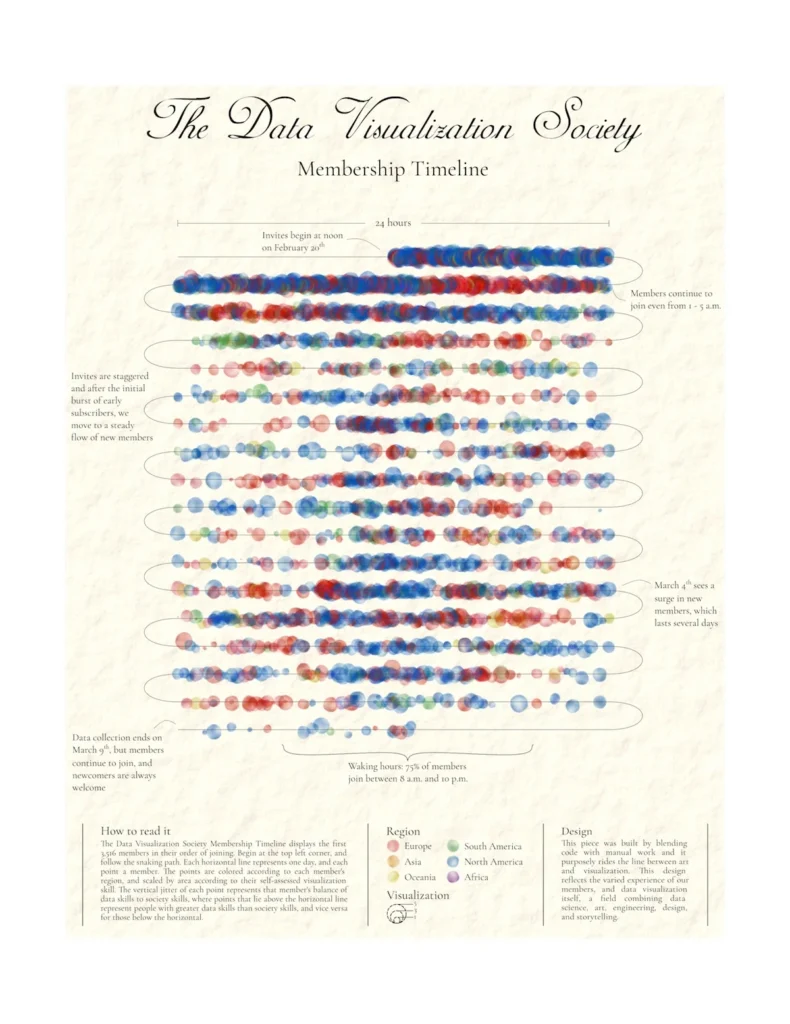
The Data Visualization Society Membership Timeline
Member Data
Will Chase
CREATED BY: Will Chase (@W_R_Chase, williamrchase.com) DESCRIPTION: A snaking switchback style timeline that visualizes each DVS member as a watercolor splotch. Dots are sized by…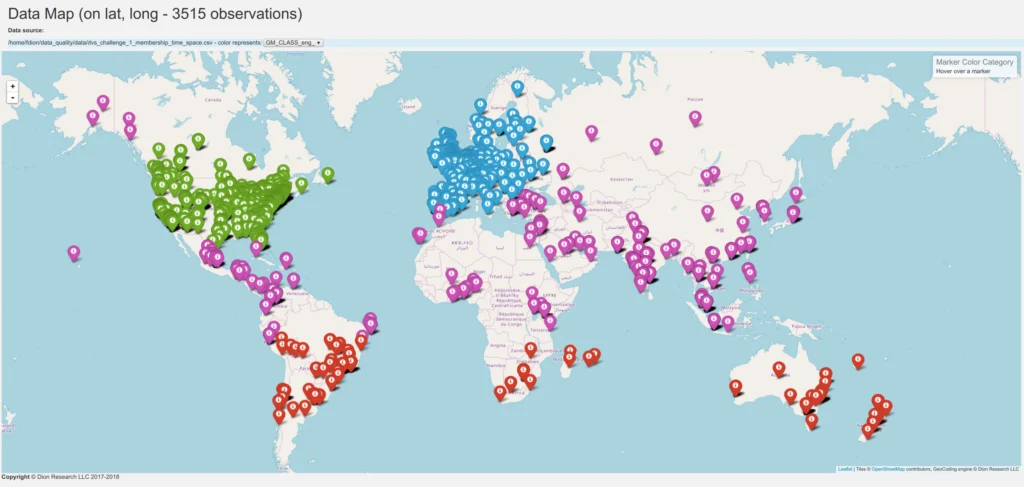
Visu.ai Interactive data map
Member Data
Francois Dion
CREATED BY: Francois Dion - fdion@dionresearch.com DESCRIPTION: Mapping all signups as lat/long on a map, marker color is based on the clustering. Clustering is automatically…
Visualization of #datavizsociety
Member Data
Vadim Shmygov
CREATED BY: Vadim Shmygov DESCRIPTION: The most DataVizSociety Members are from North America, USA. Top-3 European cities by members — London, Paris and Madrid. However,…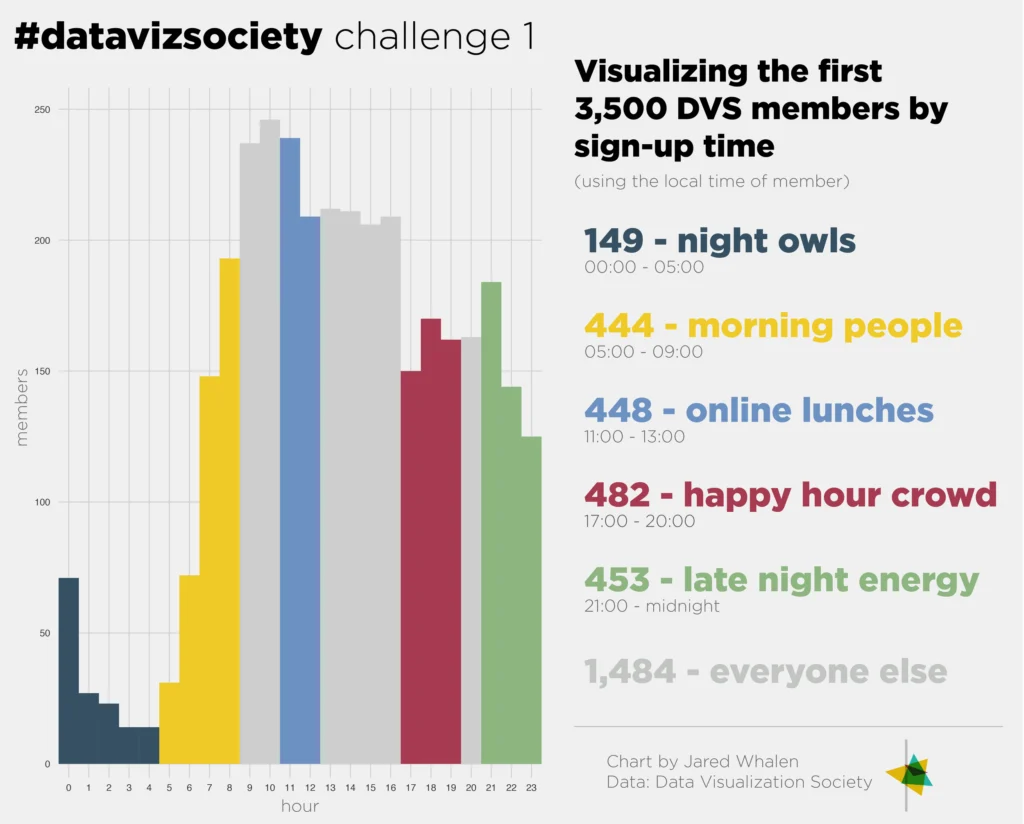
Visualizing the first 3,500 DVS members by sign-up time
Member Data
Jared Whalen
CREATED BY: Jared Whalen DESCRIPTION: Using the coordinates to determine local time, I grouped the sign ons by hour and specified playful groupings. PROCESS FOR…