Visualize the Membership – 1 year
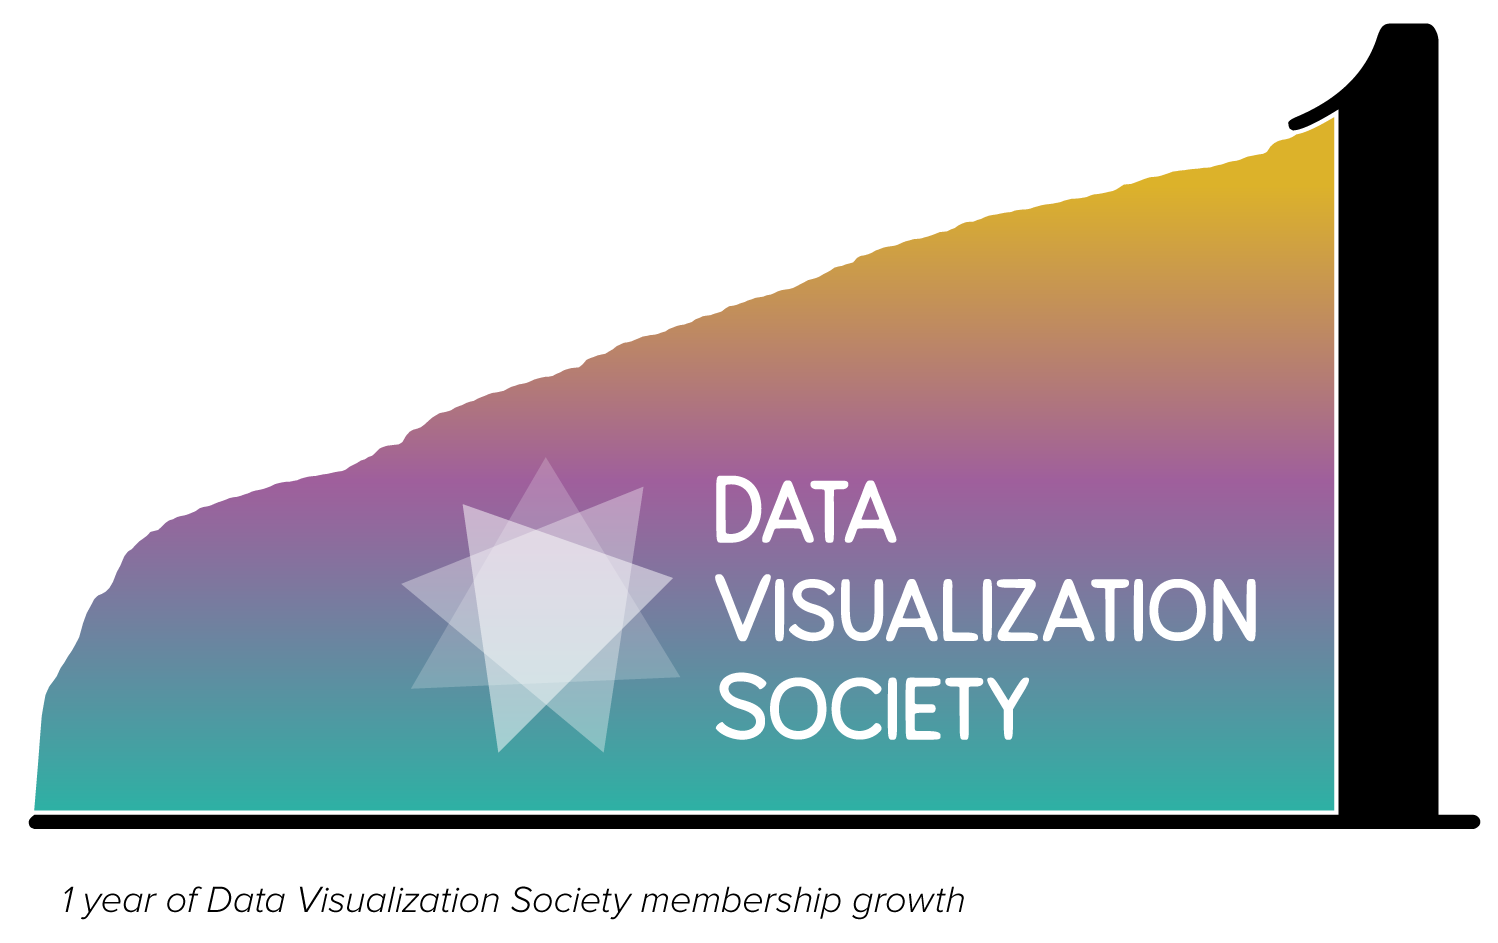
One short year ago, DVS was born. And now we have 11,500+ members! To celebrate, we asked our members to visualize the data and, just as they did 11 months previously for our one-month anniversary, our members have done it again. See the fantastic visuals of our membership below.
Submissions
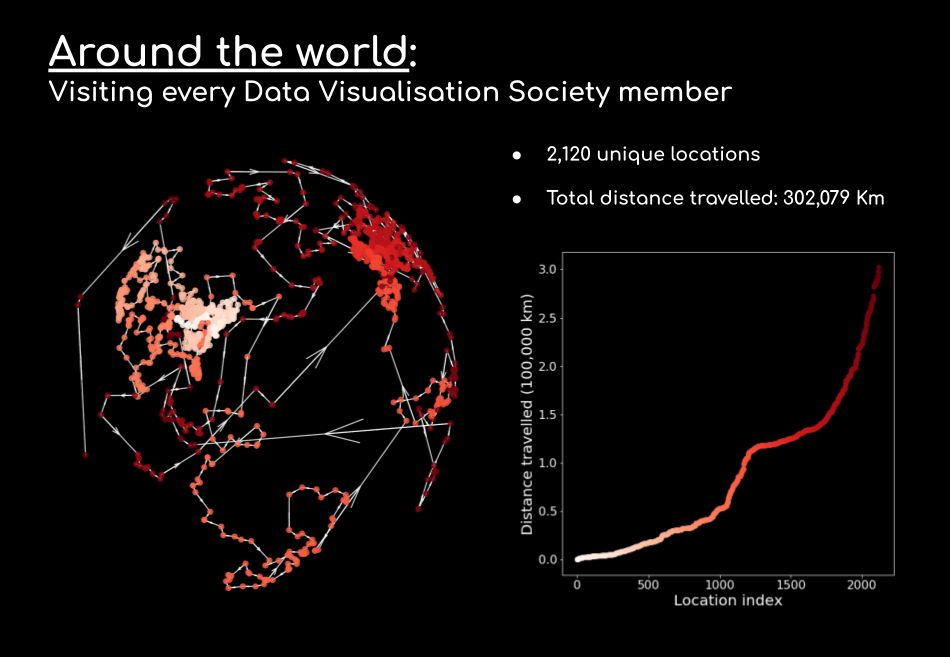
Around the world
by Matt Garrod
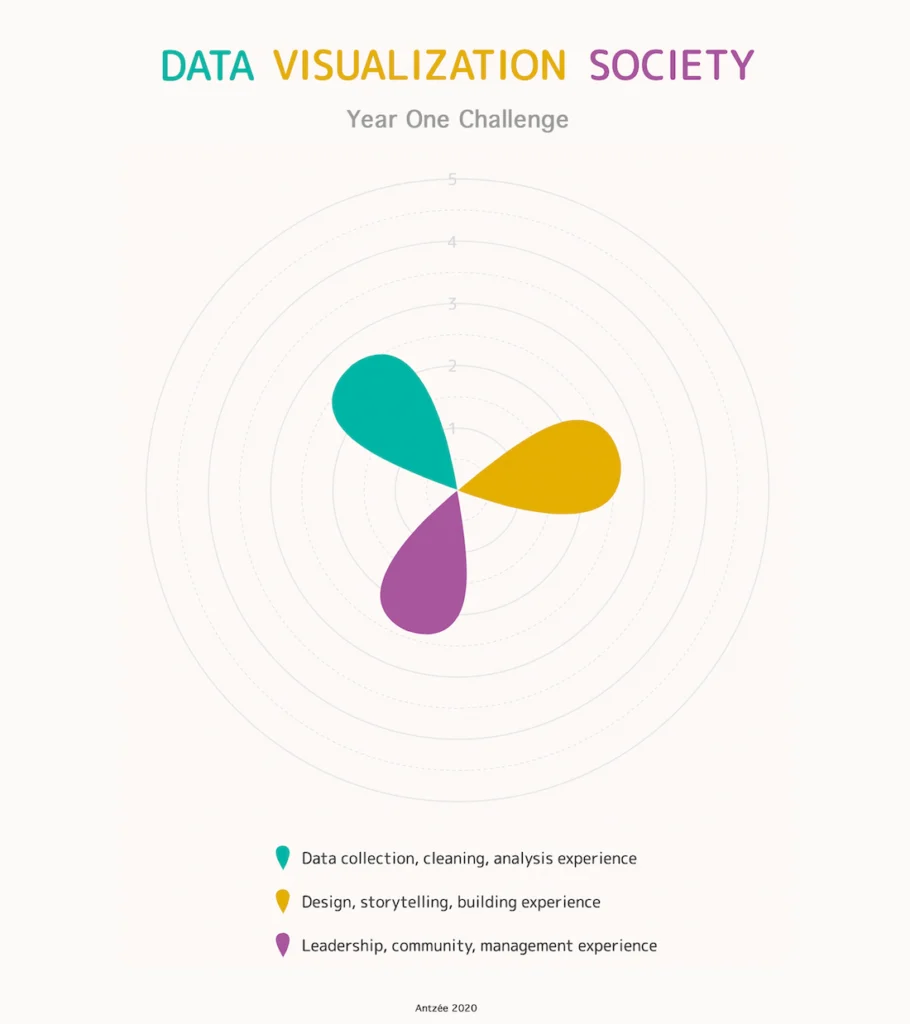
Data Vis Flower
by Trud Antzée
DATA VISUALIZATION SOCIETY : VISUALIZING 1Y MEMBERSHIP – MARCH 2020
by @Gwen A

Data Visualization Society Members Heat Map
by Rakim T. Reid – Old Dominion University
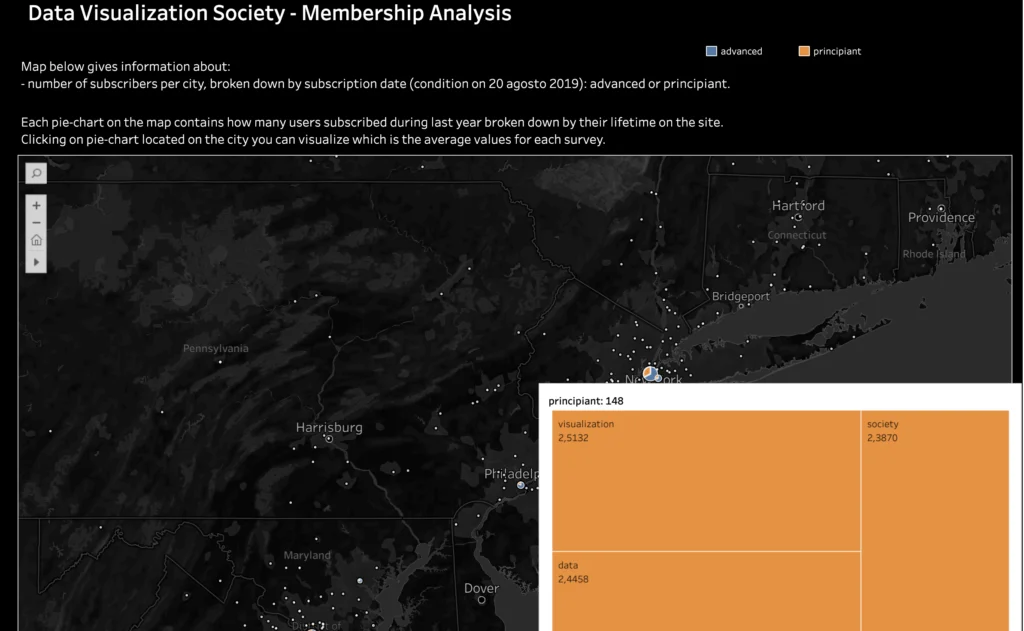
DATAVIZer on Map
by Fabio Barbazza
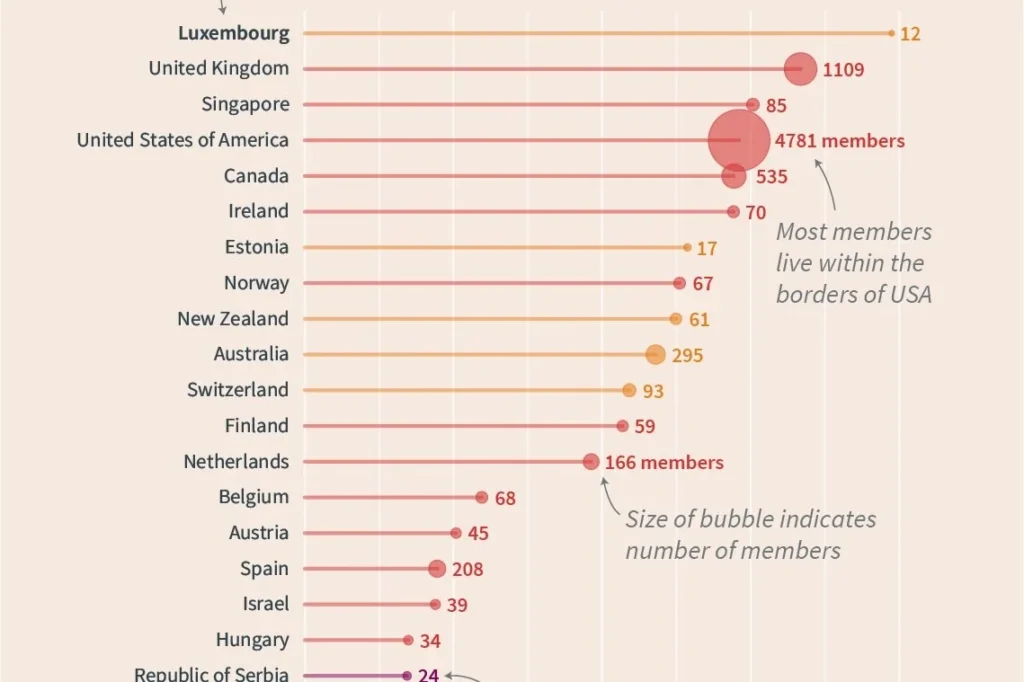
DVS is Global-With Room To Grow
by Adam Korengold
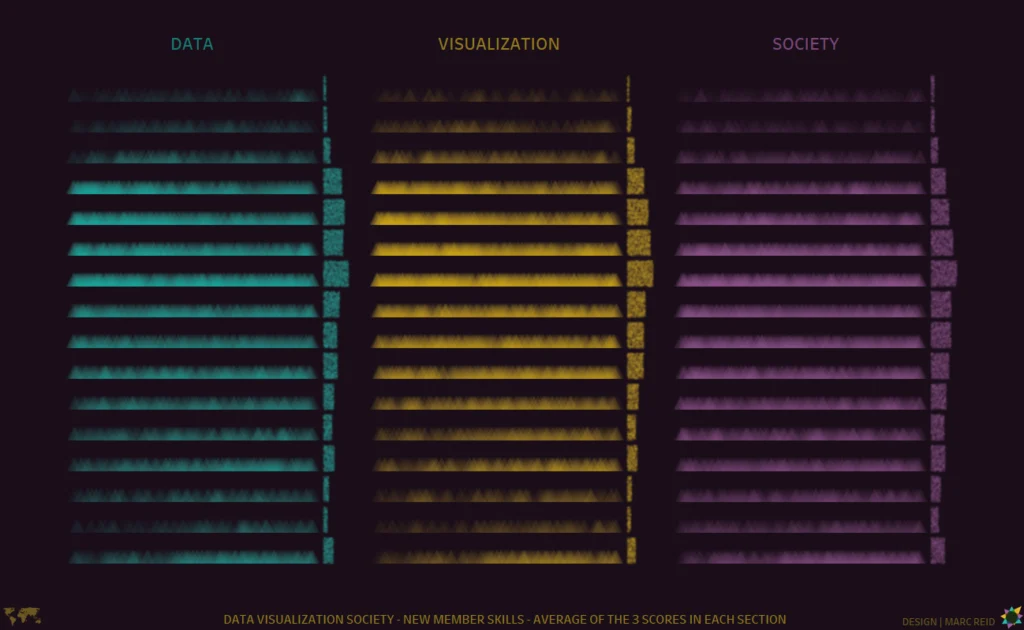
DVS Members – Feb 2019 – Feb 2020
by Marc Reid
DVS members per capita
by Jon Olav Eikenes
Global visualization of DVS members
by Pranavathiyani G
Happy Anniversary DVS!
by Julian Hernández
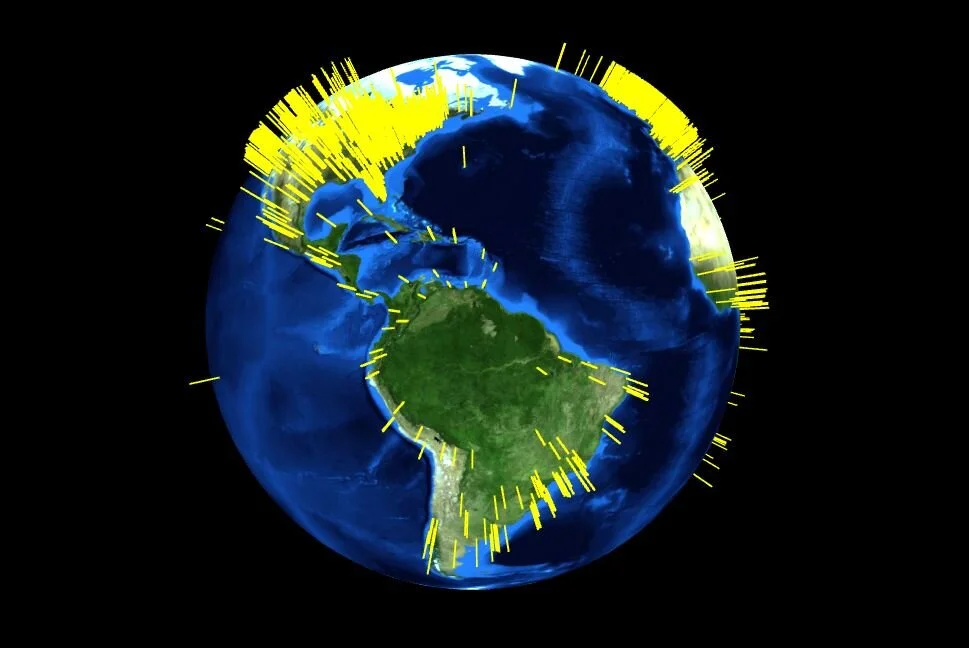
Idiocentric view of DVS signups
Member Data
Amelia Wattenberger
Created by: Amelia Wattenberger ? Description: In which direction are DVS members and how far away are they? Visualize the community relative to your location…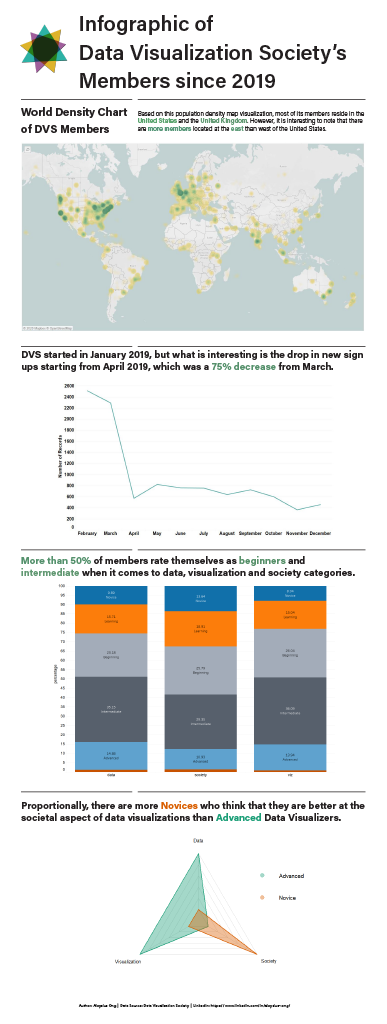
Infographic of Data Visualization Society’s Members since 2019
by Aloysius Ong Wei Han
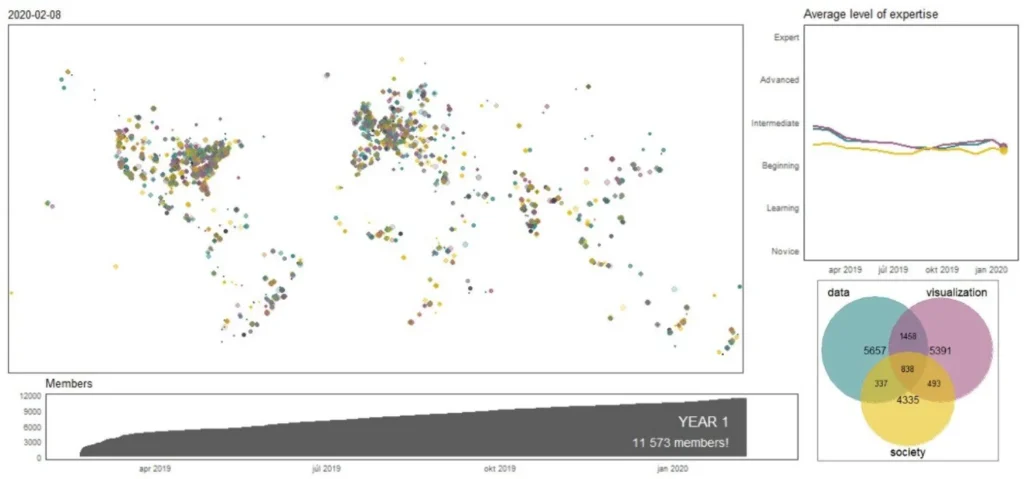
Members expertise
by Martina
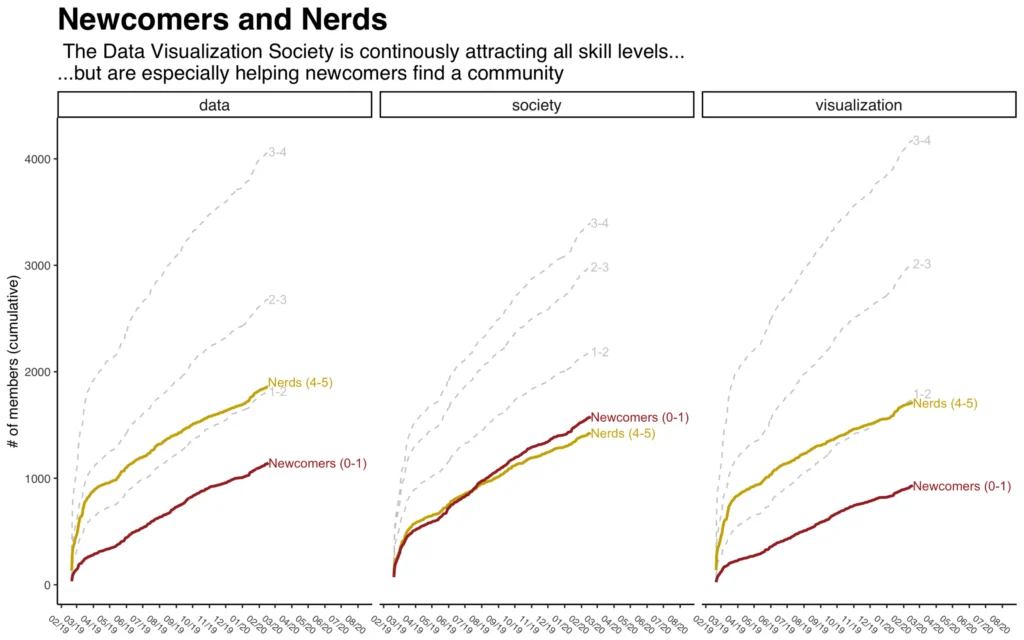
Newcomers and Nerds
by Rasmus Ludvigsen

O primeiro ano da DVS e a importância da visualização de dados
by Vinícius Cassio Barqueiro
One Year of Data Visualization Society Membership in the U.S.
by Huy Nguyen
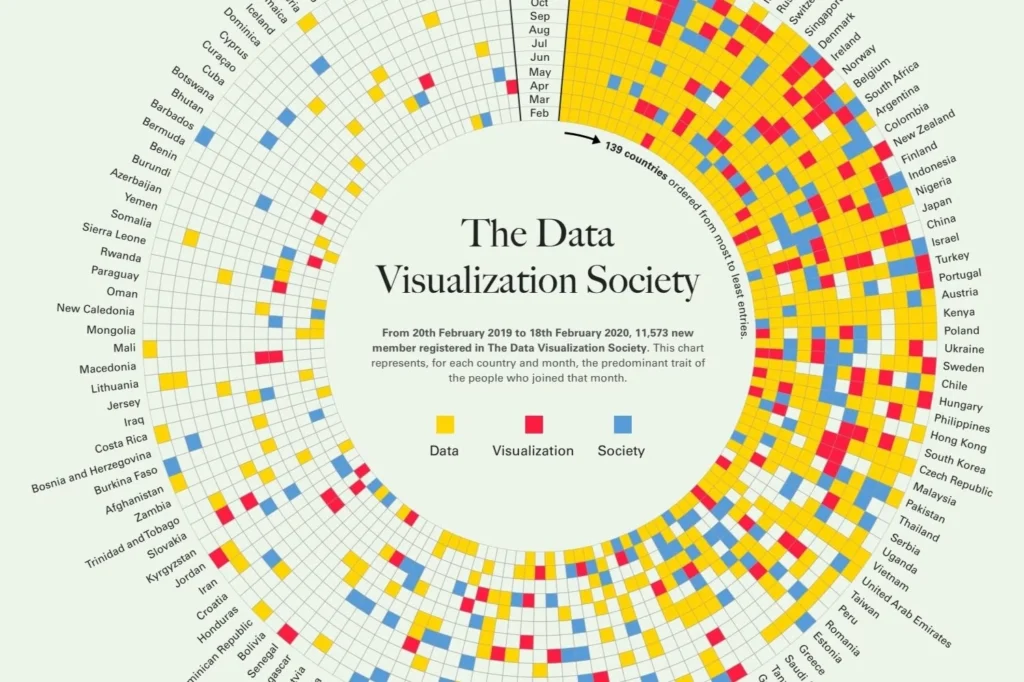
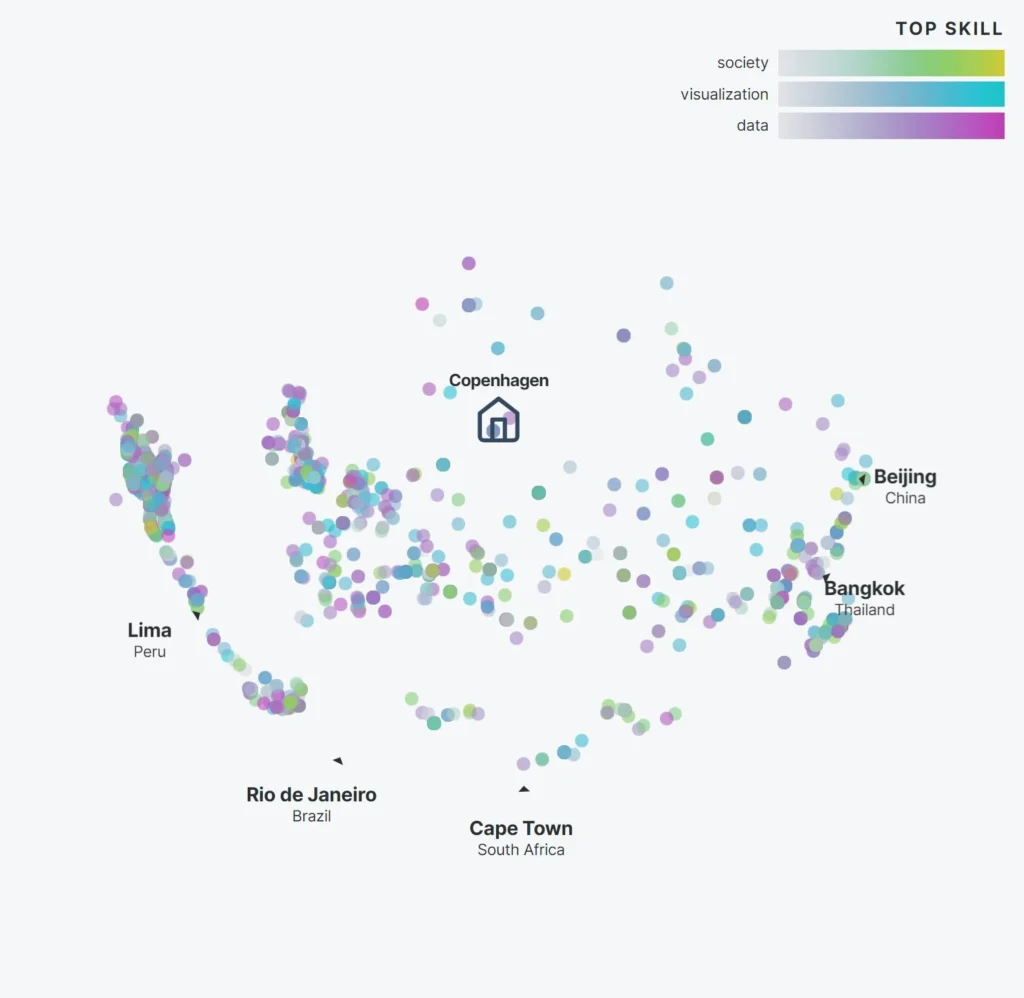
The DVS dominant traits across space and time
by Greta C. Vega & Estefanía Casal
The first year of Data Visualization Society (DV
by Vinícius Cassio Barqueiro