SOTI Challenge 2022

Read all about it!! The State of the Industry Survey Challenge winners have arrived!!
Now we celebrate! There are first, second, and third place winners for both exploratory and explanatory visualizations (all highlighted below).
EXPLORATORY DATA VISUALIZATION
The most useful exploratory visualization. We want to see dashboards and other visualizations that let people generate and test their hypotheses about what motivates and affects the field.
EXPLANATORY DATA VISUALIZATION
The most engrossing explanatory visualization. We want to see the trends in the data and how they weave together to tell us what’s happening in the data viz community.
Rules
Each person can only enter two submissions and only one submission for each category.
Entries are open to Data Visualization Society members. If you are not a member, it’s easy and free to join. Sign up here.
Groups can enter but any cash-value prize will be awarded to the individual submitting the entry. Any group entry must be a list of names and cannot be an organization. Gallery space + online ribbons can be shared by all group members named.
You must use the 2021 Annual State of the Industry Survey Data. You are also welcome to use annual survey data from previous years or other relevant datasets. If you use any additional datasets, they need to be cited.
Any work presented must be your own.
By entering you give DVS the non-exclusive right to publish your work and/or screenshots of it. (Examples of use: social media, website, emails and reports)
All work must adhere to the DVS Code of Conduct.
DVS board members, advisory committee, judges and their immediate family are not eligible to win prizes. However, they may enter and be included in the full gallery.
The Data Visualization Society reserves the right to not award a prize for a category.
Submissions
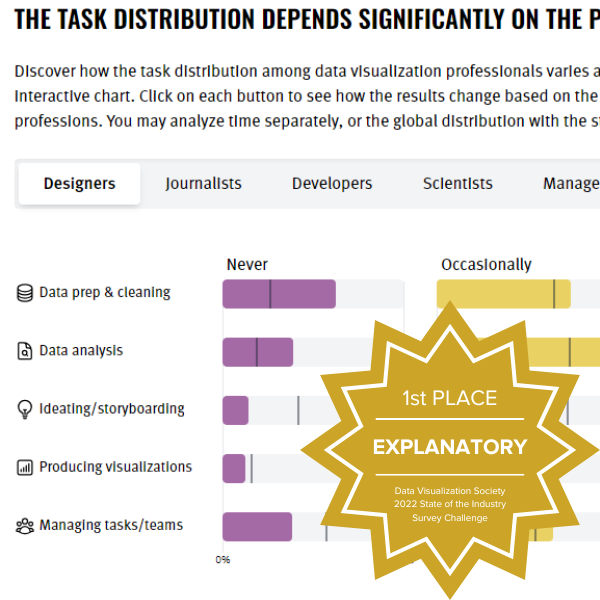
How data visualization professionals spend their time?
explanatory
Pere Rovira & Rosanne Kruithof
Tools of the Trade
exploratory
Steinar Shellenberger
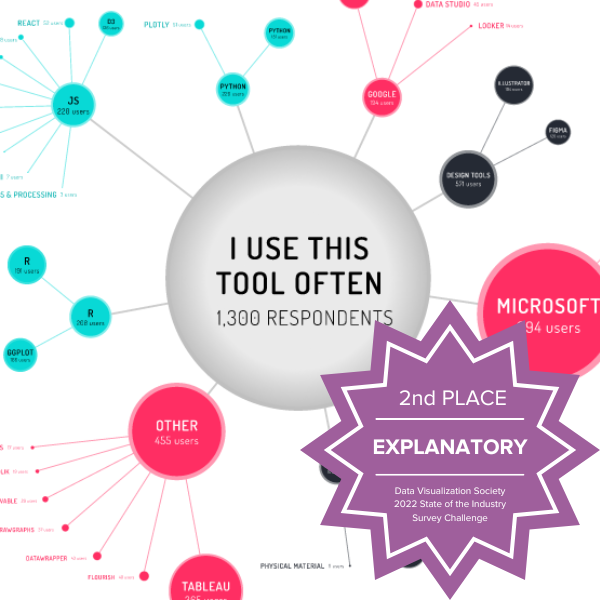
I USE THIS TOOL OFTEN
explanatory
James Wood
Which of these charts have you created in the last 6 months?
exploratory

DataViz Confessions
explanatory
Hamsa and Arpit from 36truths
Pirouette Table: a fancier (but perhaps less useful) Pivot Table
exploratory
Daniel Lewis
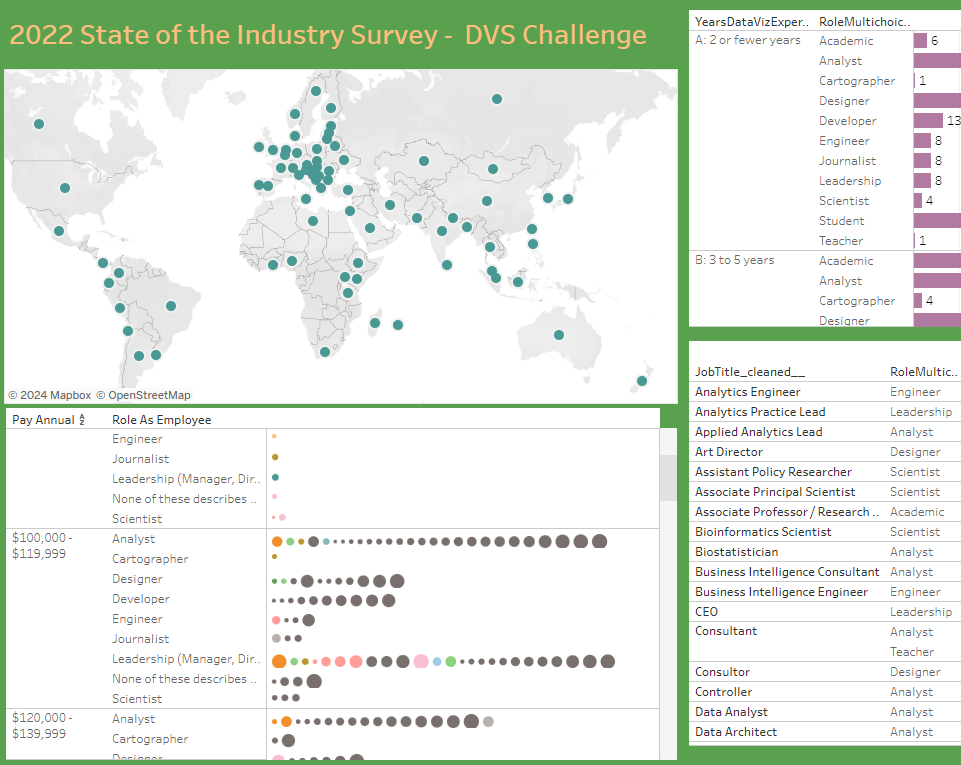
2022 State of the Industry Survey – DVS Challenge
exploratory
Juanita Palomar
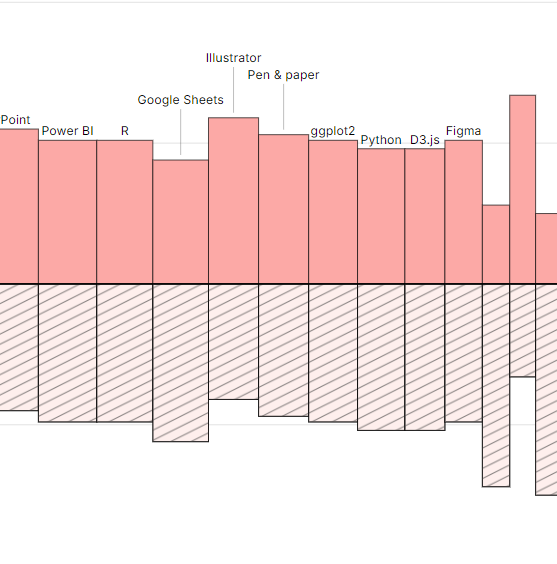
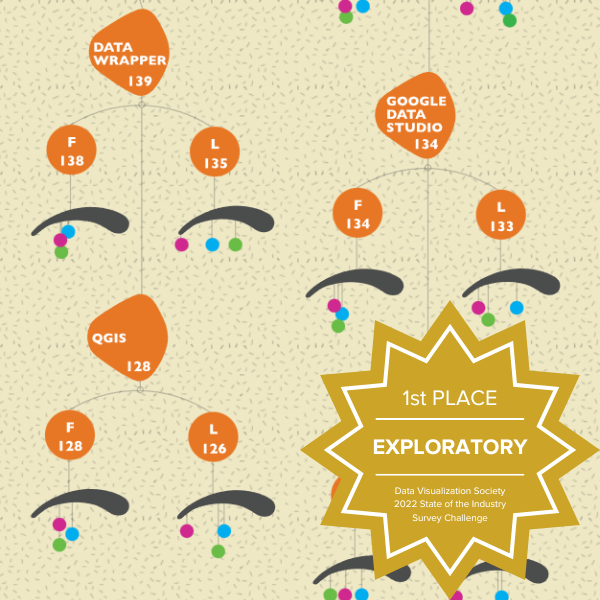
Data Visualization Technologies: usage frequency and user preferences explored
exploratory
Anca Sarb
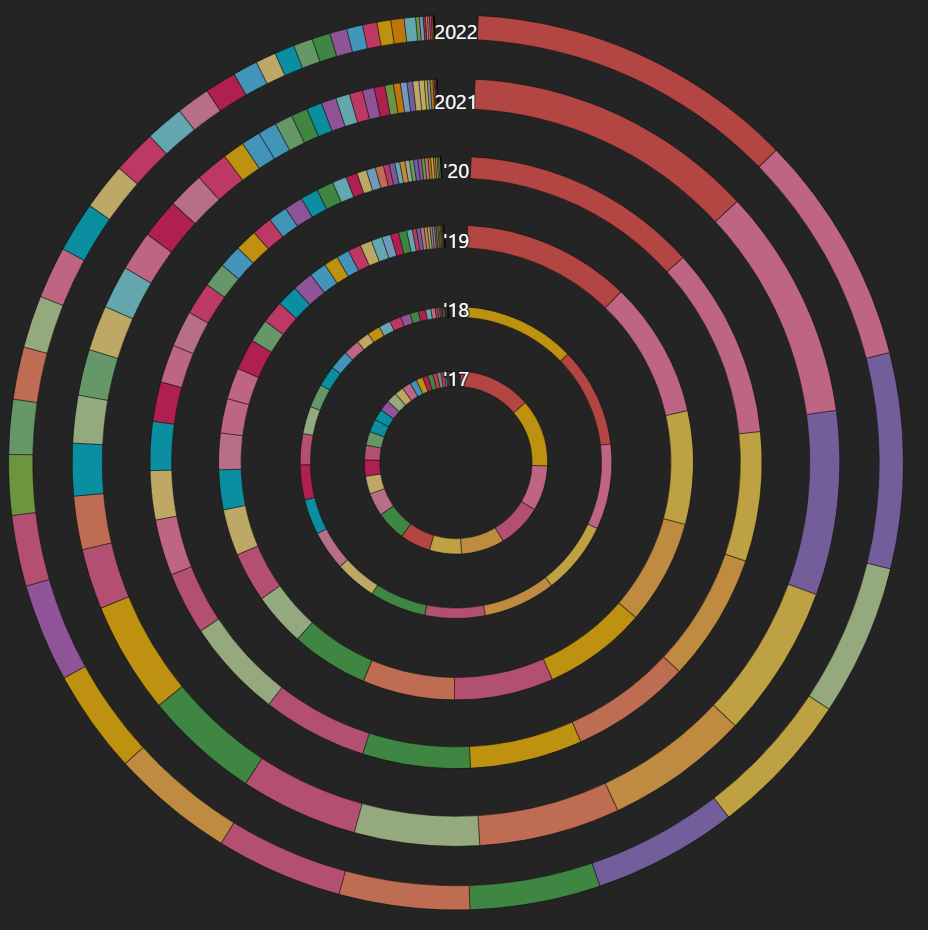
Evolution of Data Viz Tools (2017 – 2022)
exploratory
Kelsey Nanan
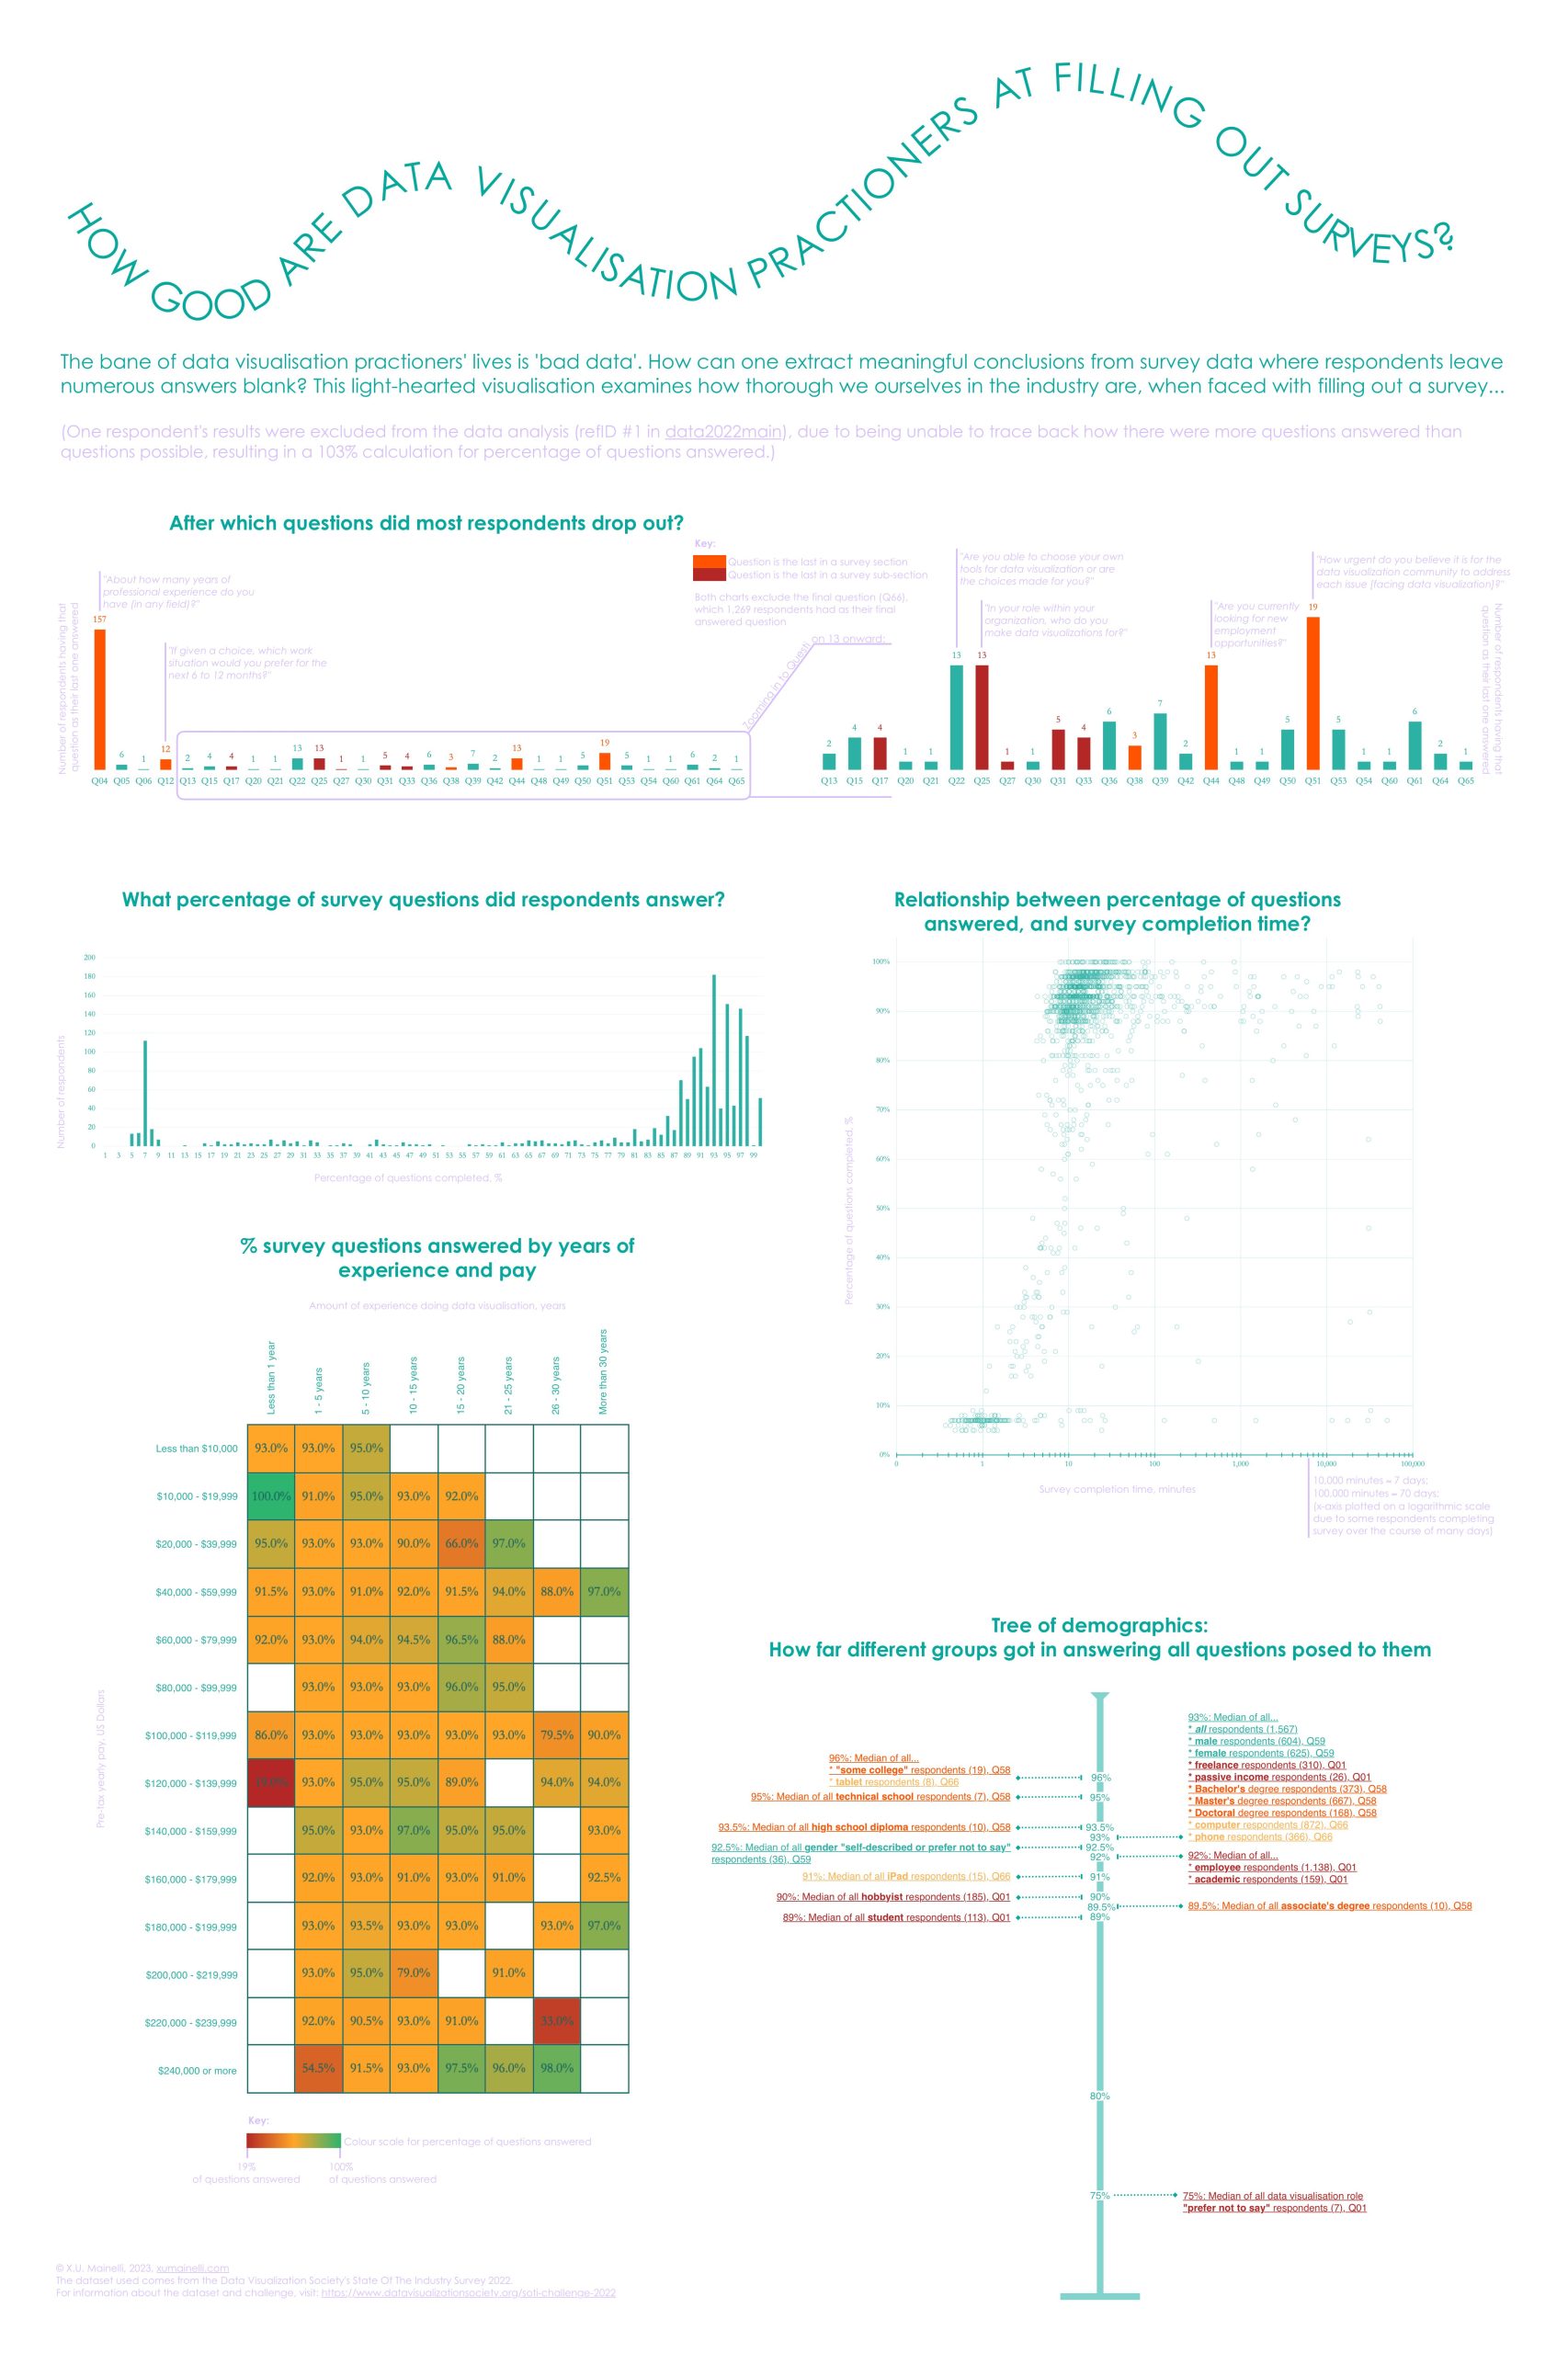
How Good are Data Visualisation Practioners at Filling Out Surveys?
explanatory
X.U. Mainelli
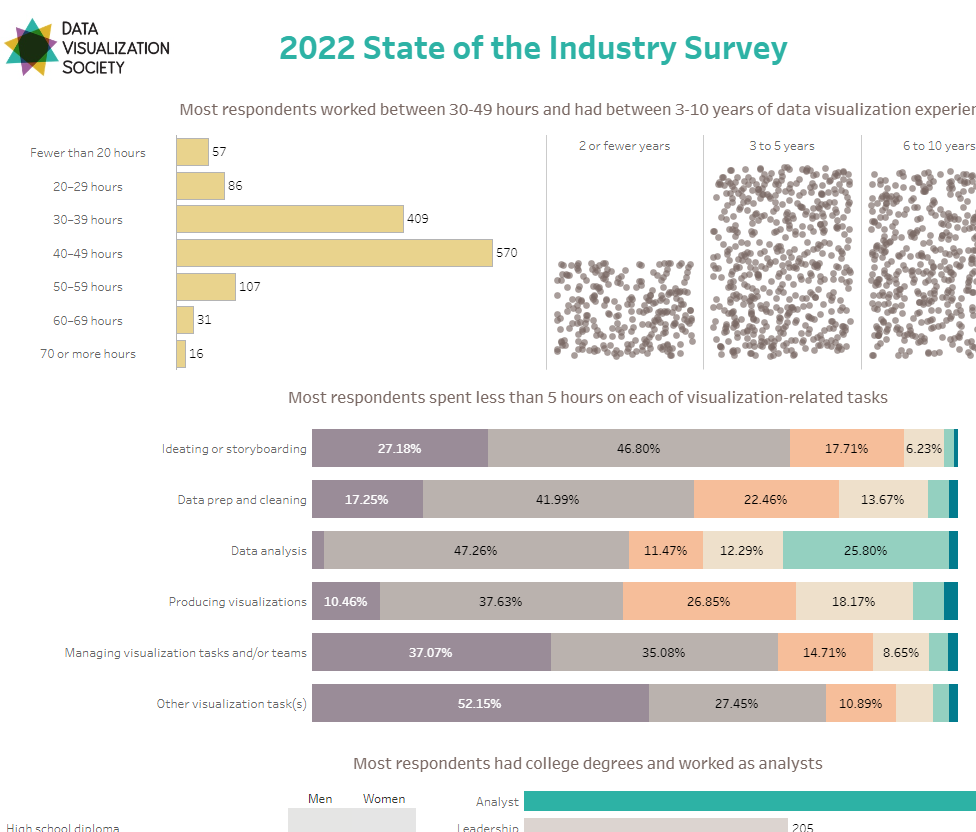
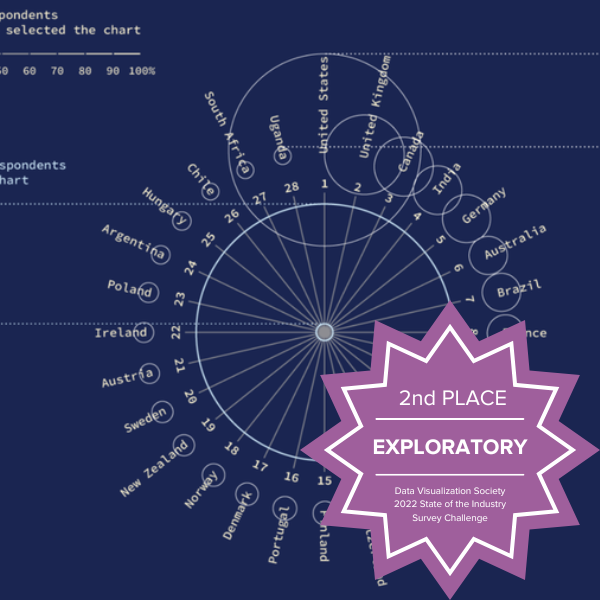
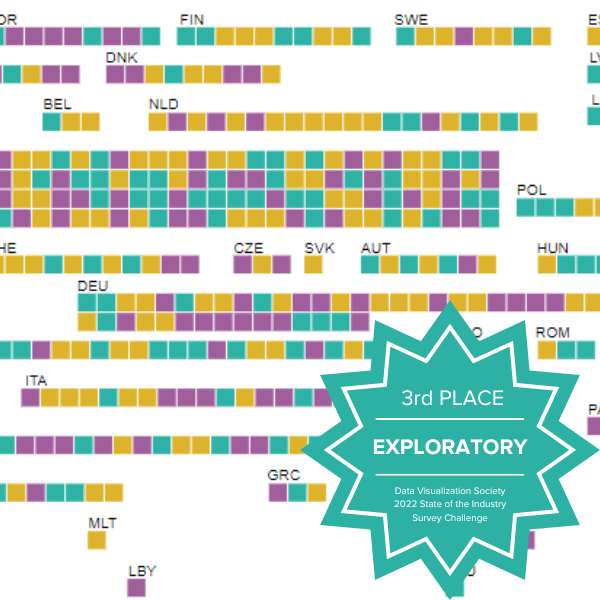
State of the data visualization industry
exploratory
Karolina Grodzinska
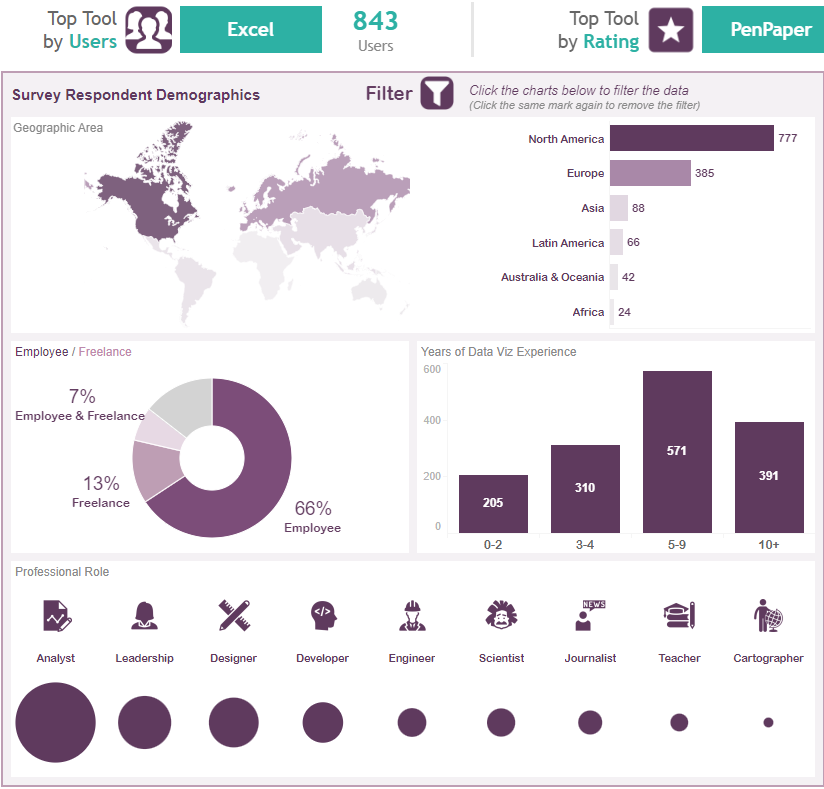
State of the Industry (SOTI) Dashboard
exploratory
Teboho Letuka
State Of The Industry Survey Results 2022
exploratory
Viktoriia Vasiukova
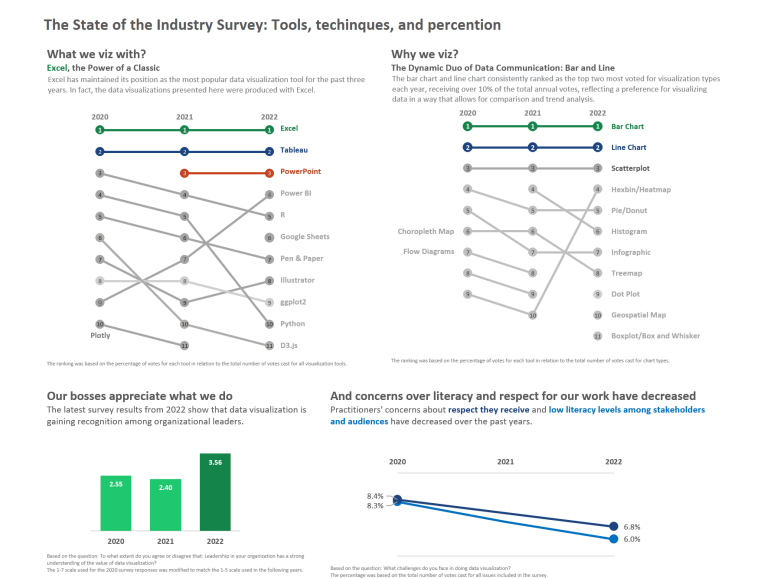
The State of the Industry Survey: Tools, techinques, and percention
explanatory
Vasa Buraphadeja
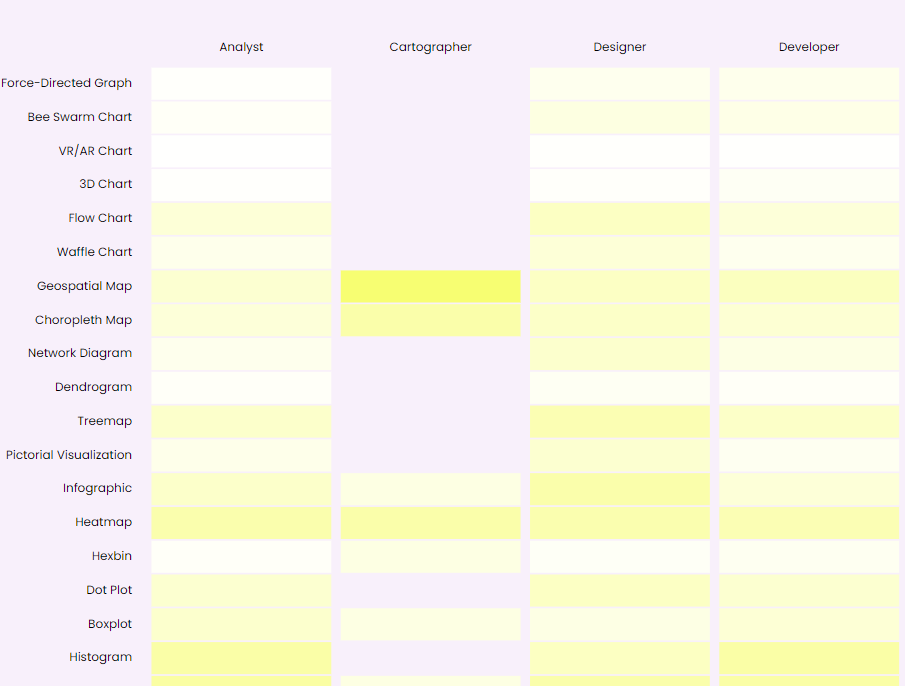
Tools and Charts We used for Dataviz
exploratory
KeyEun Lee
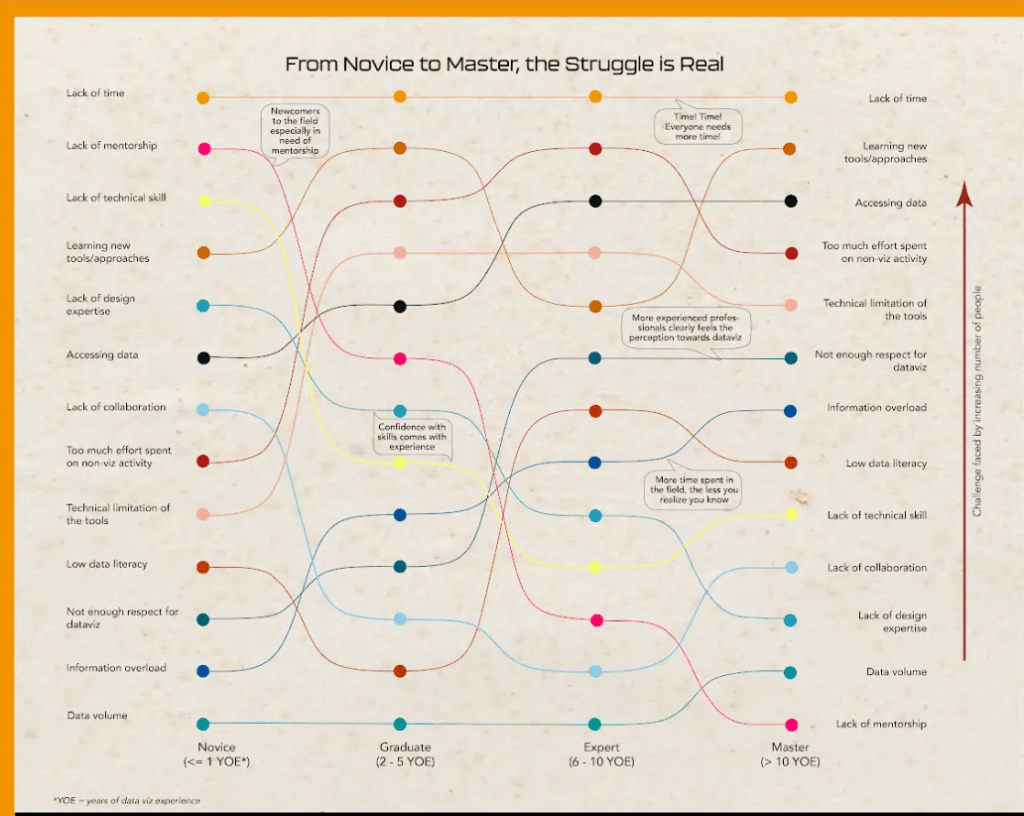
Visualizing Data: From Novice to Master, the Struggle is Real
explanatory
Arielle Kan
What are the most frequently used Data Visualization Tools?
exploratory
Rachel E Cinelli

Who Inspires Us?
explanatory
Declan Bradley